Overall satisfactory tap water
Published:
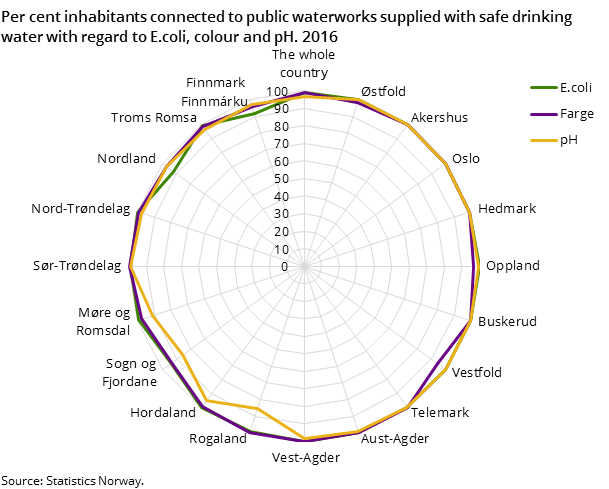
In 2016, around 99 per cent of inhabitants connected to municipal waterworks were supplied with acceptable drinking water in terms of content of thermo-tolerant intestinal bacteria (E. coli). This level is the same as previous years. Around one-third of the water is estimated to be “lost” through leakage on its ways from the waterworks to the consumers.
- Full set of figures
- Municipal water supply
- Series archive
- Municipal water supply (archive)
Furthermore, slightly less than 99 per cent of the same inhabitants were supplied with satisfactory water quality in terms of colour, while 97 per cent were supplied with satisfactory water quality in terms of acidity (pH). This constitutes roughly a 1 per cent increase for both colour and pH compared to the year before.
Around 1 100 municipal waterworks
Around 4.4 million inhabitants in Norway were connected to the 1 100 municipal waterworks located around the country in 2016 (not including those serving only schools and kindergartens). This corresponds to a share of 84 per cent of Norway’s population. Dispersed across the water distributing system, this implies an average of 93 inhabitants per kilometre of pipeline. When also including private waterworks, the total is around 4.6 million inhabitants and 1 950 waterworks.
Safety and readiness plans to combat “unwanted incidents”
In 2016, almost 94 per cent of the municipal waterworks had a safety and readiness plan aimed at combatting unwanted incidents e.g. pollution hazards, failure in hygienic barriers and other technical failures, drought/flood and accidents. Furthermore, around 34 per cent of the municipal waterworks carried out safety and readiness training and 55 per cent of them updated their plan.
0.7 per cent of pipelines renewed
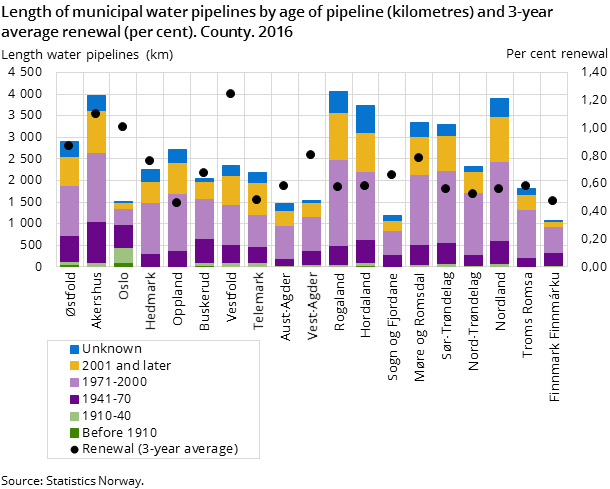
The renewal rate of municipal water pipelines varies from one year to another. Calculated as a 3-year moving average for the period 2014-2016, the rate of renewal is 0.70 per cent of the total pipeline system. This is around the same level as the previous 3-year average (2013-15).
The current renewal rate means that it will take almost 143 years to renew the whole pipeline system, assuming that no new pipelines are installed in the coming years.
Half the pipeline system dates from 1971 to 2000
The length of the municipal water pipelines is estimated to be nearly 47 600 kilometres; around 1.2 times the earth’s circumference at the equator. Forty-seven per cent of the municipal pipeline system was laid between 1971 and 2000, while around 3 per cent was laid before 1940 and 24 per cent between 2001 and 2016.
The age of the pipeline system for the country as a whole is estimated at 32 years. It should however be stressed that the age and quality of the pipeline systems may vary considerably between different municipalities.
Around half an hour delivery failure
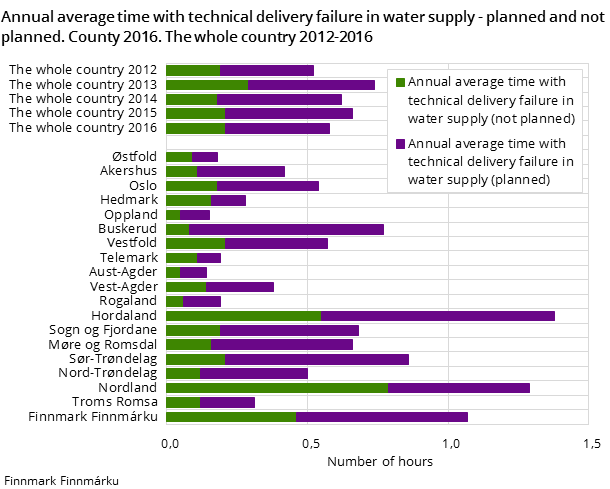
The estimated average annual technical delivery failure in the municipal water supply in 2016 was around 35 minutes per person. Around 36 per cent of this, or around 13 minutes, is related to unplanned incidents by the waterworks.
Furthermore, around 3 700 leakage repairs were also estimated to have been carried out on the water pipeline system in 2016, corresponding to 1 leak repair per 10 kilometres of pipeline.
Leaking water pipeline system
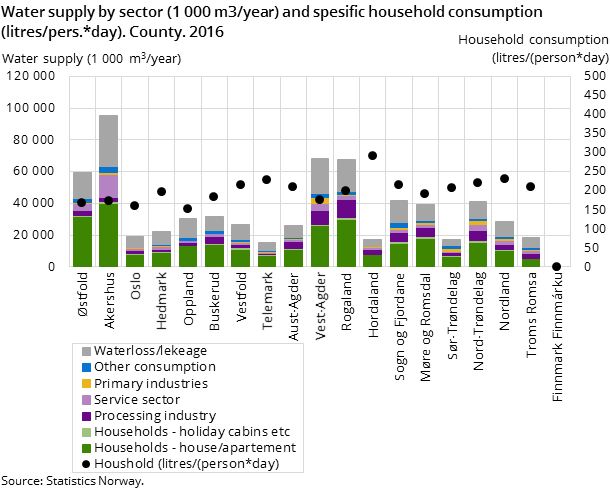
In 2016, around one in every three litres, or around 31 per cent, of the 710 million cubic metres of drinking water supplied by the municipal waterworks is estimated to be “lost” through leakage.
The leakage corresponds to 4.6 cubic metres of water per metre of pipeline system. According to KOSTRA figures (system for municipality-state-reporting), the loss through leakage has been relatively stable throughout the last ten years.
In comparison, around 42 per cent of water supplied by municipal waterworks to the pipeline system is consumed by households. An additional 2 per cent is consumed in holiday cottages or holiday homes. This gives a specific water consumption in the households of around 190 litres a day per person.
Income from fees and fee calculation basis almost equal
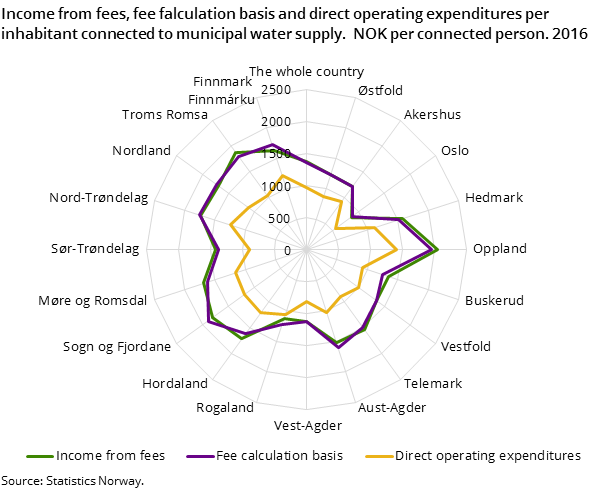
The fee calculation basis per inhabitant was NOK 1373 in 2016, an increase of approximately four per cent from 2015. The income from fees per inhabitant in 2016 was NOK 1363, and was at the same level as the previous year.
More regionally, the highest fee calculation basis per inhabitant and incomes from fees per inhabitants are found in the county of Oppland, while Oslo is at the other end of the scale.
Municipal costs in the water sector are predominantly covered by fees paid by the users of the service. Regulations stipulate that fees in the municipal water and wastewater sector cannot exceed the municipality’s actual costs for providing that particular service (“self cost”). Accurately stipulating income from fees to cover the real calculation basis in a single year is complicated. Thus, the municipalities are allowed to decide on fee levels so that income from fees over a five-year period equals the fee calculation basis.
The sum of the income from fees was almost equal to the sum of the fee calculation basis for 2016. This also applies to the period 2012- 2016.
Contact
-
Gisle Berge
-
Marit Slåen Sæther
-
Jørn Kristian Undelstvedt
-
Statistics Norway's Information Centre

