Service industry waste steadily increasing
Published:
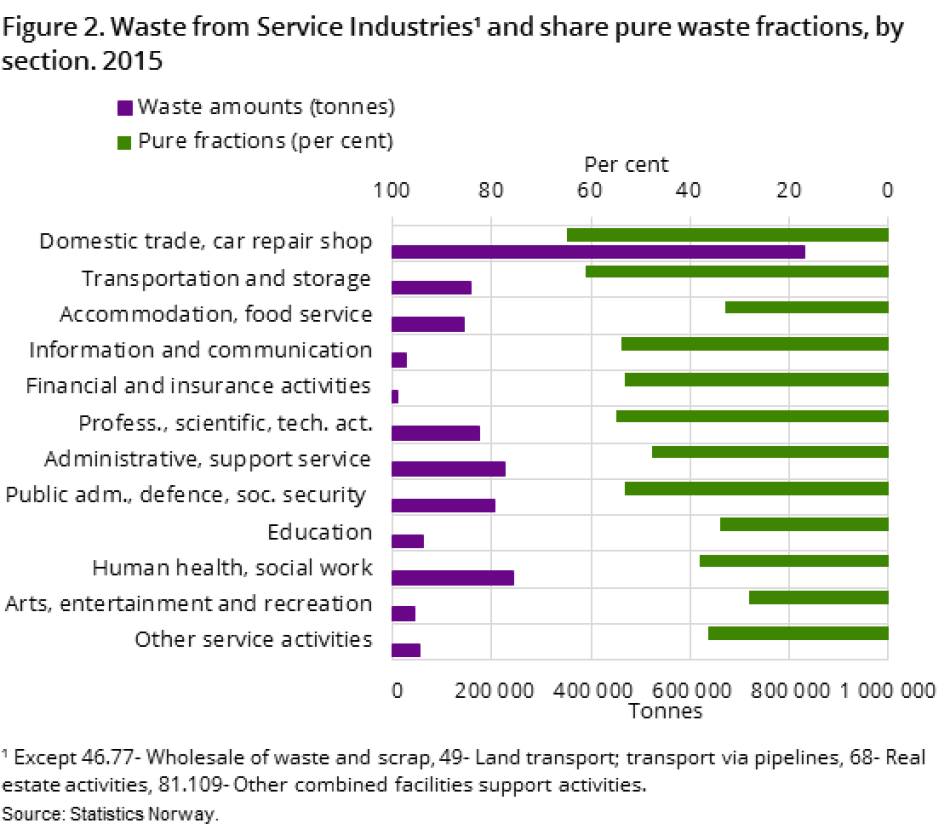
The service industries generated just short of 2.2 million tonnes of waste in 2015. As before, the domestic trade business had the highest share of the waste, with 38 per cent.
- Full set of figures
- Waste from service industries
- Series archive
- Waste from service industries (archive)
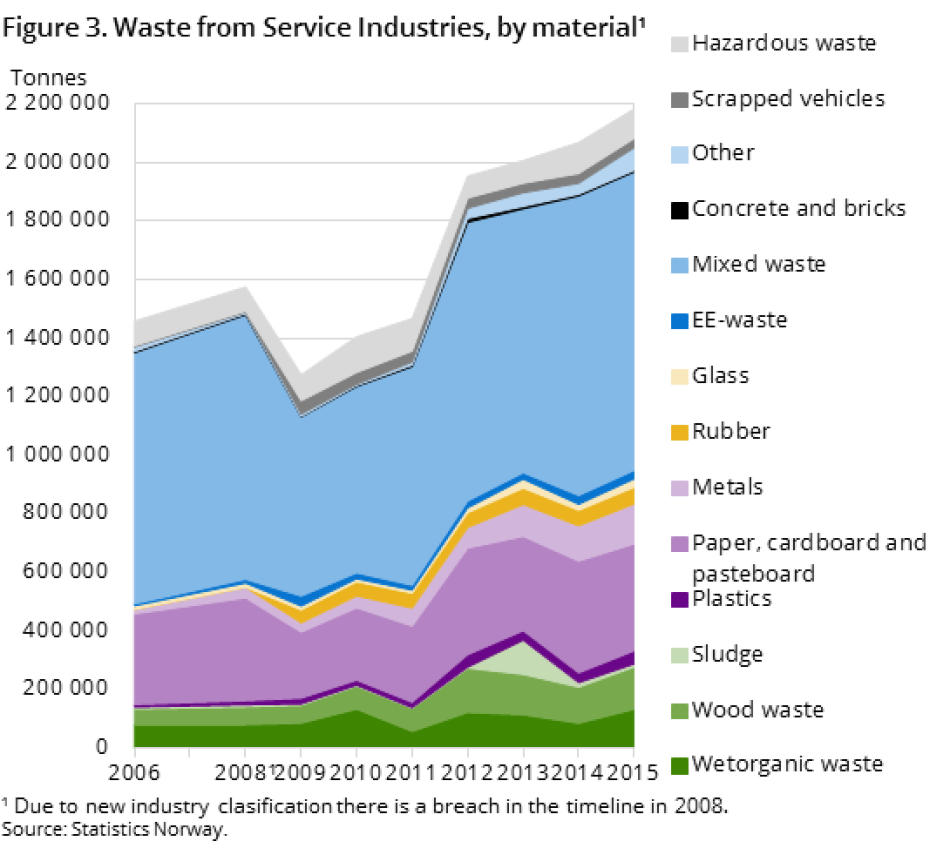
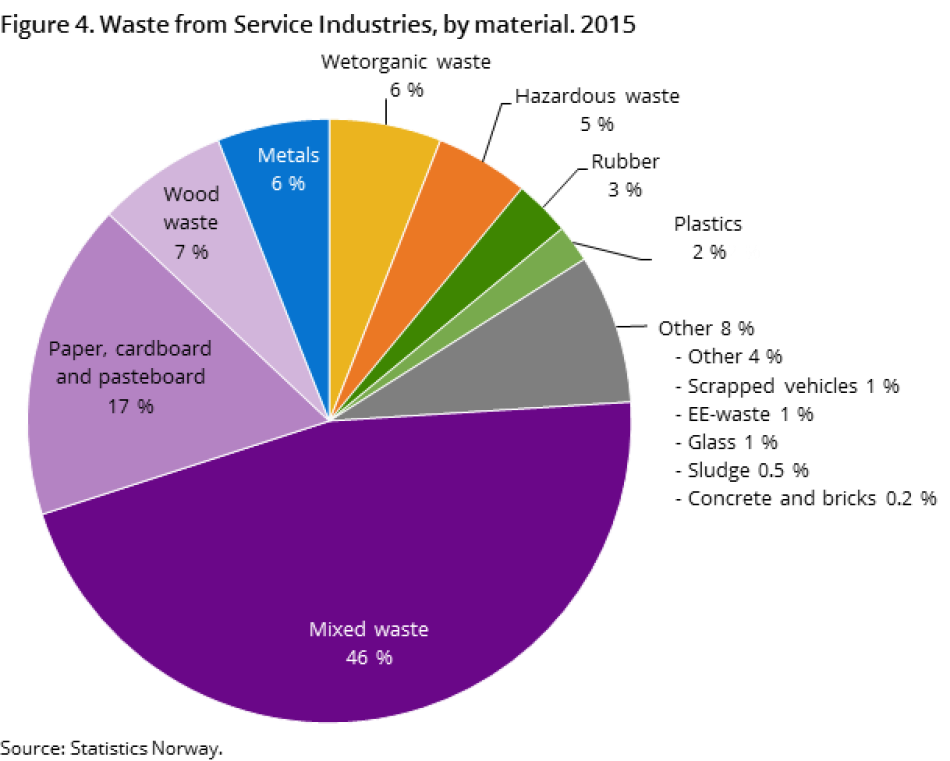
The waste amounts from the service industries increased by more than five per cent from 2014 to 2015. Mixed waste is still the largest waste fraction, with 47 per cent of the total waste.
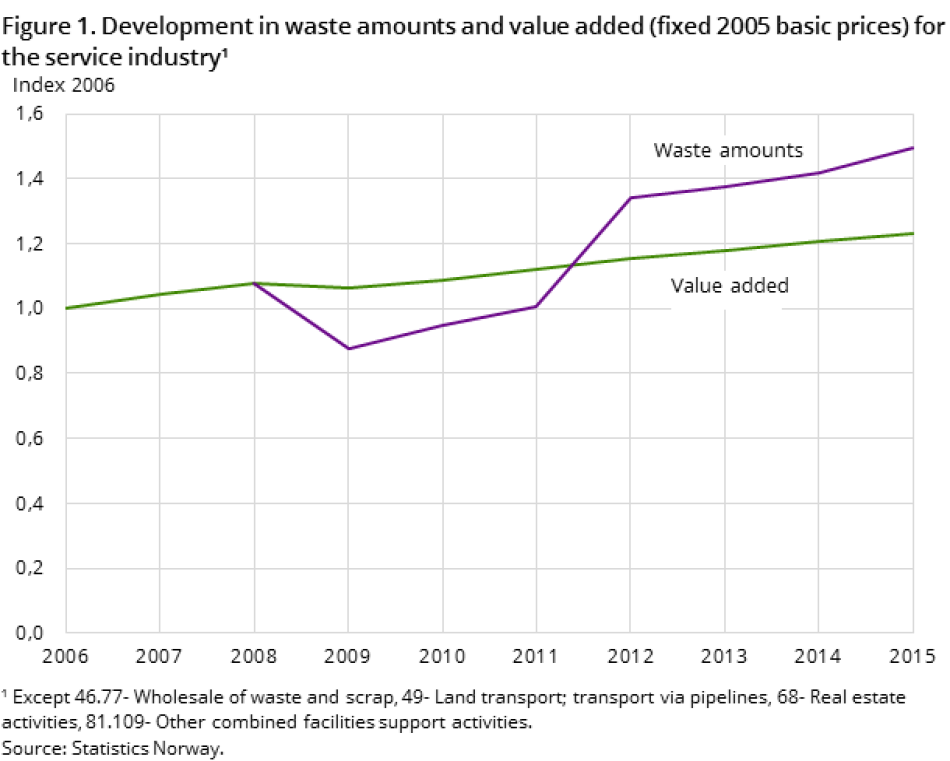
The waste amounts from the service industries have increased by 50 per cent since 2006. In comparison, the value added (fixed 2005 basic prices) for the industry increased by only 23 per cent during the same period. This implies that the industry has become less waste efficient during the last eight years.

Most waste from the domestic trade business
More than 830 000 tonnes of waste, or 38 per cent, came from the domestic trade business in 2015. Second and third in magnitude are human health and administrative and support service activities, with 11 and 10 per cent of the total waste amounts respectively.

Increase in other materials, decrease in sludge
Several waste fractions increased from 2014 to 2015, including “Other materials”, which covers, for example, bricks, gypsum, ceramics and medical waste. The increase was 107 per cent from 2014 to 2015. The second and third largest increases were for wet organic waste and glass waste.

Despite the general increase in waste amounts, some waste fractions have decreased. The largest decreases in terms of percentage were sludge followed by concrete and scrapped vehicles, with a reduction of 31, 18 and 5 per cent respectively.

Contact
-
Statistics Norway's Information Centre
