Two thirds of Norway’s coast is accessible to the public
Published:
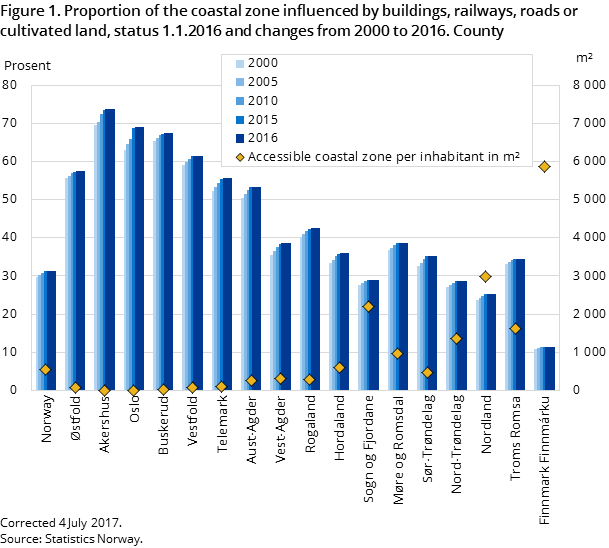
A third of the Norwegian coastal zone is affected by human activity, but there are large regional differences. The coastal zone along the Oslo Fjord is least accessible.
- Full set of figures
- Construction in the coastal zone
- Series archive
- Construction in the coastal zone (archive)
The part of the coastal zone that is considered as not accessible to the public includes mainly areas affected by buildings, but also agricultural land, roads and train lines. In order to protect the coastal zone and to reduce pressure on land resources due to construction, the government issued new planning guidelines in 2011.
The coastal zone along the Oslo Fjord, which includes the counties Akershus, Oslo and Buskerud, is least accessible in Norway. Only 30 per cent is open to the public, and about 60 per cent is affected by buildings. Here we also see the largest decrease in accessible coastal zone in recent years.
The coastal zone in Southern Norway is less affected by human activity than the Oslo Fjord area, but pressure on land resources due to construction is still high. Nearly half of the coastal zone is considered accessible, but about a third is affected by buildings.
By comparison, the west coast and the North of Norway has less pressure on land resources due to construction activity. Along the west coast, about 75 per cent of the coastal zone is accessible. However, nearly a third of this is considered too steep for outdoor activity.
Figure 2. Land use in coastal area divided by human activities in municipalities along the fjord of Oslo and other municipalities with high and low pressure on land areas. 1. January 2016
| Potentially accessible coastal area > 25 degrees | Potentially accessible coastal area < 25 degrees | Influence area around buildings < 50m | Cultivated land | Railway surface | Road surface | |
| Average for municipalities with low pressure on land areas | 22.2 | 51.0 | 12.6 | 12.1 | 0.0 | 2.1 |
| Average for municipalities with high pressure on land areas | 11.6 | 43.1 | 29.7 | 12.8 | 0.1 | 2.7 |
| Average for municipalities along the Oslofjord | 5.0 | 34.3 | 51.5 | 5.7 | 0.2 | 3.3 |
Less construction activity
Construction activity in the coastal zone has generally declined since 2009. An exception is Oslo county, where the part of the coastal zone that is affected by human activity has increased at a faster pace in recent years.
The number of new buildings in Norway’s coastal zone has declined by about a third since 2005. The main reason for this is that there are fewer garages and annexes being built. Other building types such as dwellings and holiday houses have remained at a more or less stable level.
Figure 3. Number of building start permits granted in the coastal zone per year
| 2005 | 2006 | 2007 | 2008 | 2009 | 2010 | 2011 | 2012 | 2013 | 2014 | 2015 | |
| All building types | 5650 | 6010 | 5569 | 4759 | 5154 | 4796 | 4657 | 4673 | 4578 | 4169 | 3839 |
| Dwelling | 1175 | 1285 | 1046 | 849 | 978 | 846 | 895 | 949 | 992 | 904 | 1017 |
| Mountain farm hut, fishermens shack, cabin, turf hut etc. | 51 | 24 | 38 | 36 | 28 | 27 | 31 | 12 | 31 | 36 | 23 |
| Holiday house | 1147 | 1270 | 1172 | 853 | 846 | 689 | 759 | 656 | 639 | 544 | 562 |
| Garage, outhouse, annex linked to dwelling | 2713 | 2808 | 2739 | 2433 | 2670 | 2659 | 2395 | 2499 | 2432 | 2146 | 1811 |
| Industrial building and warehouse except fishery and agricultural building | 203 | 205 | 214 | 266 | 254 | 395 | 102 | 283 | 210 | 264 | 193 |
| Fishery and agricultural building | 92 | 102 | 89 | 105 | 118 | 119 | 113 | 100 | 112 | 106 | 81 |
| Other building | 269 | 316 | 271 | 217 | 260 | 221 | 202 | 174 | 162 | 169 | 152 |
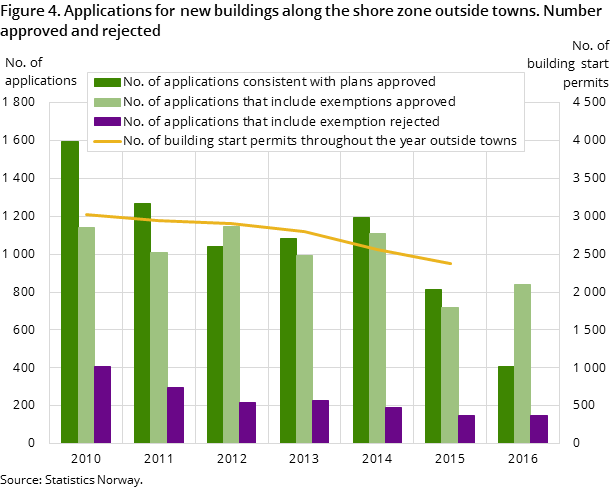
It is generally prohibited to build in the coastal zone in Norway, but exemptions can be sought. The number of exemptions that Norwegian municipalities receive has been declining in recent years. The share of granted exemptions has remained stable between 80 and 85 per cent since 2012.
Contact
-
Kirsten Elisabeth Holz
-
Erik Engelien
-
Statistics Norway's Information Centre


