Content
Published:
This is an archived release.
Half of us have safe access
Around half of the population can safely access recreational areas and areas for recreational walking from our dwellings according to new calculations.
| 2013 | ||
|---|---|---|
| Proportion with access to recreational areas | Proportion with access to areas for recreational walking | |
| All ages | 55 | 49 |
| -20 years | 58 | 53 |
| Kindergarten | 64 | 48 |
| School building | 53 | 40 |
| Detached house | 56 | 56 |
| House with two dwellings | 52 | 49 |
| Row house, linked house and house with 3 or 4 dwellings | 62 | 54 |
| Multi-dwelling building | 44 | 33 |
| Residence for communities | 55 | 47 |


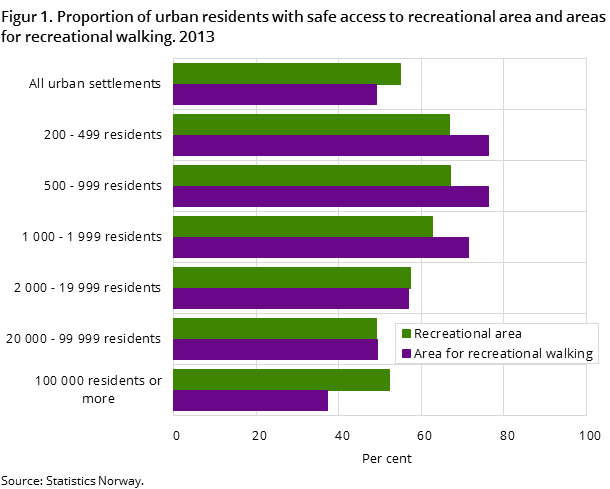
More exactly; 55 per cent of residents in urban settlements have access to recreational areas, while 49 per cent have access to areas for recreational walking. A higher proportion of residents in small urban settlements have safe access compared to larger urban settlements (figure 1). Overall, 67 per cent of residents in the smallest urban settlements have safe access to recreational areas, while the corresponding figure for the biggest cities is 52 per cent. There is a greater disparity between big and small cities in relation to safe access to areas for recreational walking (76 per cent for small urban settlements vs. 36 per cent for the biggest cities).
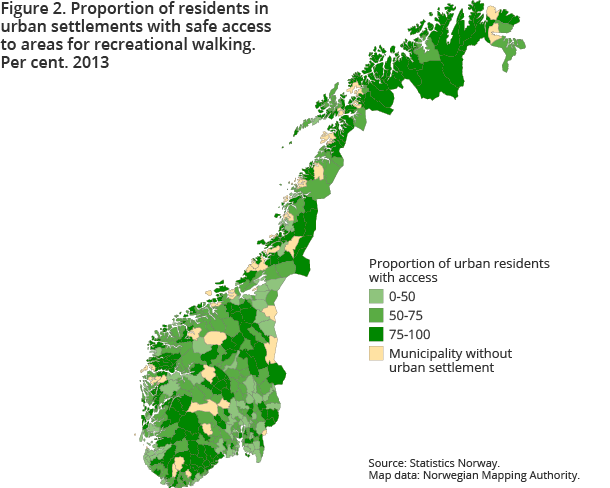
The proportion of residents with safe access may also be low in small urban settlements, despite a clear correlation between urban settlement size and safe access in general (figure 2). This is especially the case in areas with widespread agricultural land.
More children have access
More children and young people have access to recreational areas and areas for recreational walking than the population at large (3 percentage points). This is because children tend to live closer to recreational areas serviced by footpaths and cycle paths and other low traffic roads.
More kindergartens than schools have safe access
A higher share of kindergartens has safe access than schools. Blocks of flats have significantly less access than other building categories. This can be attributed to these buildings being predominantly located in central, more dense and busy parts of cities.
70 square metres per resident
The total recreational area within urban settlements is around 290 km2. Residents in urban settlements each have on average 70 m2 of recreational area. Residents in the biggest urban settlements have on average the smallest recreational area at their disposal.
The figures are not comparable with previously published figuresOpen and readClose
The data sources have been improved in recent years, particularly in relation to data on lesser roads, footpaths and cycle paths. In addition, the method has been slightly altered. The changes mean that the 2013 results are not comparable with previously published figures for 2011. We have however recalculated the figures for 2011 with edited data. Because of the changes in data, we have not published figures for 2011 on detailed regional level, only for the whole country. The area figures have also been changed as a consequence of new methodology delimiting urban settlements from 2013 onwards.
Additional information
The data source for recreational areas is the land use and land cover map for Norway. More on this data set and associated statistics in the link below.
Contact
-
Tom Anders Engebakken
E-mail: tom.engebakken@ssb.no
tel.: (+47) 47 46 47 66
-
Jørn Kristian Undelstvedt
E-mail: jorn.kristian.undelstvedt@ssb.no
tel.: (+47) 94 50 68 64
