Content
Published:
This is an archived release.
Almost 2 million tonnes of waste from the service industries
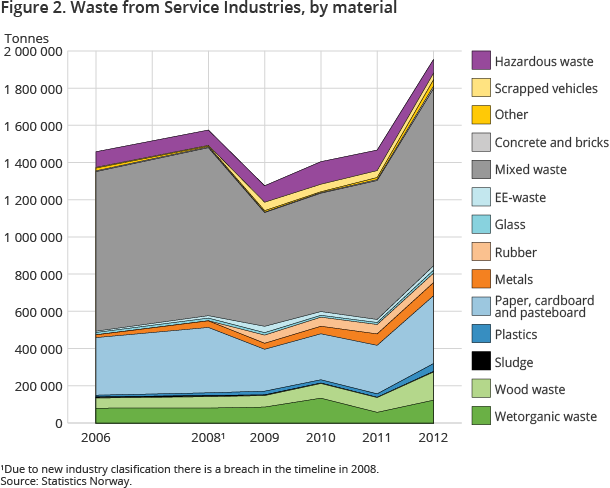
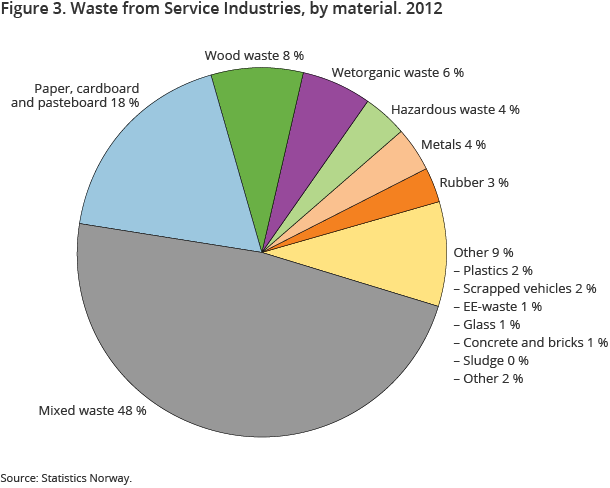
The service industries generated almost 2 million tonnes of waste in 2012. Nearly 40 per cent of the waste originated in the domestic trade business. About half of the waste was mixed waste.
| Tonnes | Per cent | Per cent | ||
|---|---|---|---|---|
| 2012 | 2011 - 2012 | 2008 - 2012 | ||
| Waste amounts by material | ||||
| In total | 1 954 057 | 100.0 | 33.1 | 24.0 |
| Mixed waste | 952 375 | 48.7 | 27.5 | 5.4 |
| Paper, cardboard and pasteboard | 364 344 | 18.6 | 39.6 | 3.7 |
| Wetorganic waste | 122 910 | 6.3 | 113.1 | 52.3 |
| Hazardous | 73 957 | 3.8 | -33.0 | -10.1 |
| Other materials | 440 471 | 22.5 | 51.0 | 178.8 |
| Waste by section | ||||
| In total | 1 954 057 | 100.0 | 33.1 | 24.0 |
| Wholesale and retail trade: repair of motor vehicles and motorcycles | 776 896 | 39.8 | 21.5 | 20.9 |
| Human health and social work activities | 271 156 | 13.9 | 40.3 | 35.5 |
| Administrative and support service activities | 245 881 | 12.6 | 77.1 | 45.0 |
| Other service sections | 660 124 | 33.8 | 33.1 | 17.2 |


The amount of waste generated by the service industries increased by more than 30 per cent in 2012 compared to 2011. This increase is partly due to a real increase in the waste amounts and partly due to improved methods to calculate the amounts. For more details about uncertainty in the figures, see the box below. Almost 780 000 tonnes of waste came from the domestic trade business in 2012. Second and third in magnitude are human health and social work services and administrative, support service, with 14 and 13 per cent of the total waste amounts respectively.
Almost all waste fractions are increasing
In 2012, more than 950 000 tonnes, or 49 per cent, were collected as mixed waste. This is a 27 per cent increase compared to 2011. The waste fractions that have the largest increase are “other waste”, “concrete and bricks” and “plastics”.
Despite the general increase in waste amounts, some waste fractions are still decreasing; “hazardous waste”, “wrecked vehicles” and “rubber”. The largest decrease is in hazardous waste by 33 per cent. However, this change is also partly due to a change in methods. See the box below on the uncertainty in the figures.
Uncertainty in the figuresOpen and readClose
The calculations are based on customer registers from a sample of waste collectors. Some of the customers probably delivered some pure waste fractions to waste collectors outside the sample, or to collectors outside the waste collection business. The total amount of waste and the amount of pure waste fractions may therefore be too low, while the share of mixed waste may be too high.
There are also changes in the calculation of hazardous waste. The figures used are from the statistics on hazardous waste, instead of using separate calculations for these statistics on service industries. This has involved some adjustments to some of the waste fractions, which accounts for the large decrease compared to earlier years.
New method from 2012 means more accurate figures and may affect comparabilityOpen and readClose
As of 2012, the sample size has been increased and the calculations have been somewhat changed. This change has led to an increase in the figures compared to earlier years. The increased sample size also contributes to the increase as fewer waste fractions are now outside the sample. We therefore assume that the uncertainty in the figures is less than before.
Contact
-
Camilla Skjerpen
E-mail: camilla.skjerpen@ssb.no
tel.: (+47) 48 22 72 14
-
Gisle Berge
E-mail: gisle.berge@ssb.no
tel.: (+47) 48 12 19 97
