Content
Published:
This is an archived release.
Steady decrease in number of wastewater facilities
In 2014 there were 2 676 wastewater facilities in Norway. This is a reduction of 300 facilities or 10 per cent, compared to 2002. The decrease is especially evident among small and direct (untreated) discharges, which commonly are discontinued or rebuilt into larger treatment plants.
| 2014 | Per cent | ||
|---|---|---|---|
| 2013 - 2014 | 2010 - 2014 | ||
| Number of wastewater facilities, 50 pe or larger | 2 676 | 0.0 | -3.8 |
| Capacity of wastewater facilities 50 pe or larger (1 000 pe) | 6 923.4 | 1.3 | 2.6 |
| Discharge phosphorus from wastewater facility 50 pe or larger (tonnes TOT-P) | 945.4 | 3.0 | 7.1 |
| Discharge organic material from wastewater facility 50 pe or larger (tonnes BOD5) | 45 264 | 2.3 | . |
| Disposal of sewage sludge to soil improvement (tonnes dry weight) | 113 688 | 1.1 | 40.4 |
| Used in agriculture | 88 018 | 6.5 | 53.8 |
| Used in parks or green spaces | 7 377 | -37.0 | -34.2 |
| Delivered to soil producers | 18 293 | 0.8 | 45.9 |
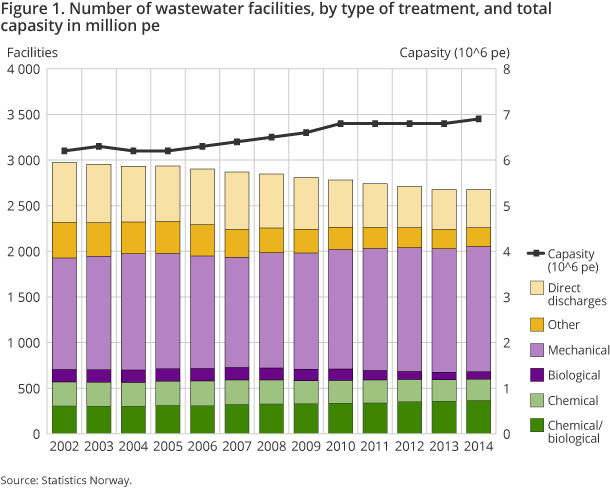
Despite the reduction, the total and aggregated capacity of the wastewater sector in the country increased from 6.2 to 6.9 million person equivalents (pe) between 2002 and 2014. This reflects a “desired development” in light of the population growth in Norway, and provides the additional people with the necessary water and wastewater services and infrastructure.
The figures above describe wastewater facilities with a capacity of 50 pe or more.
Big rather than small
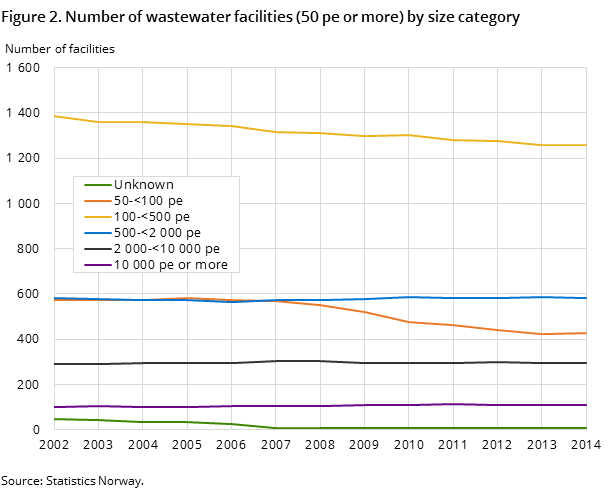
The number of wastewater facilities with a capacity of 50-500 pe has seen a clear reduction in the statistics from 2002 to 2014. The number of larger facilities is more stable, and some groups are also increasing. For example, the number of wastewater facilities with 10 000 pe or more has increased from 99 to 110 during the time series (11 per cent). Thus the current trend in the Norwegian wastewater sector is obviously to think and build bigger.
Furthermore, only a few facilities treat really large quantities of wastewater in Norway; 4 per cent of the wastewater facilities with 10 000 pe or more account for almost 70 per cent of the total capacity of the wastewater sector of 6.9 million pe. In comparison, facilities of less than 2 000 pe constitute as much as 85 per cent of the facilities, but only account for 12 per cent of the total capacity.
Fewer direct (untreated) discharges
In 2014, around 420 out of a total of 2 676 wastewater facilities constitute direct discharges, and this figure has decreased by 37 per cent since 2002. Instead, more mechanical treatment plants are being built, which it is assumed have replaced direct discharges.
The number of mechanical treatment plants has increased by 13 per cent from 2002 to 2014, and in 2014 there were around 1 400 throughout the country.
Reduced number of wastewater facilities in all counties
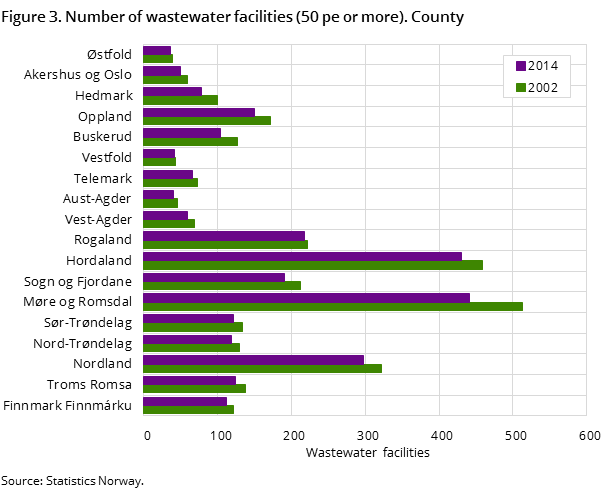
For the time series 2002-2014, there is a decrease in the number of facilities in all counties. The extent of the decrease differs from county to county, but it is generally larger among counties with a high number of facilities already, e.g. Møre og Romsdal, Hordaland and Nordland. The largest reduction is found in Møre og Romsdal, with almost 70 fewer facilities in 2014 compared to 2002. In 2014, 440 wastewater facilities were registered in Møre og Romsdal.
More details on this topic are available in the new report Municipal wastewater: Expenditures, investments, discharges, treatment and disposal of sewage sludge 2014 – Wastewater fees 2015 (in Norwegian only, with an English abstract).
Three out of five connected to high-grade treatment
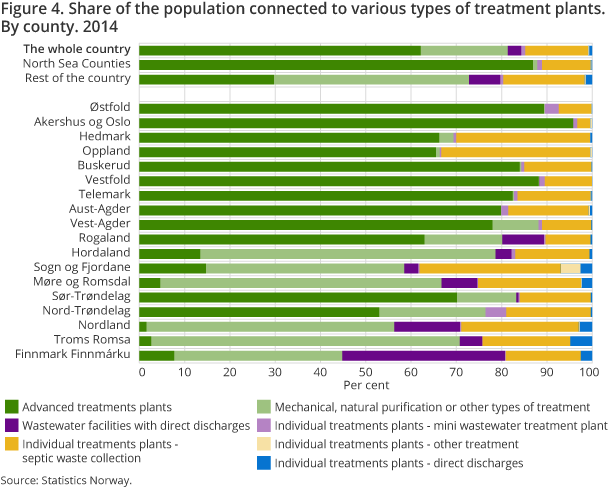
In 2014, 62 per cent of Norway’s population was connected to high-grade treatment plants – biological and/or chemical treatment. This is around the same level as in 2013.
High-grade treatment plants have the ability to remove more of the pollutants from the wastewater before being discharged into rivers and water systems compared to mechanical treatment plants. This applies in particular to phosphorous and organic material, but also other types of pollutants.
Furthermore, the statistics show that 19 per cent of the population was connected to mechanical or other types of treatment, 3 per cent had direct discharges and the remaining 16 per cent of the population were connected to small wastewater facilities (less than 50 pe).
945 tonnes of phosphorous
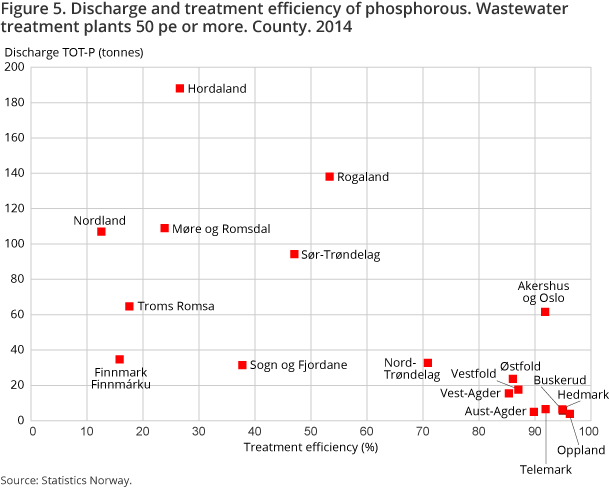
For 2014, the discharges of phosphorous (TOT-P) from municipal facilities of 50 pe or more have been estimated at 945 tonnes. This constitutes a 3 per cent increase compared to the year before. Per inhabitant connected, this discharge corresponds to 0.22 kg phosphorous per year.
When estimations of leakage from the pipeline system (145 tonnes) and discharges from small independent wastewater facilities (350 tonnes) are also added, the total figure is around 1 440 tonnes for the whole wastewater sector. In comparison, Statistic Norway’s fertilizer survey (in Norwegian only) shows that a total of 15 200 tonnes of phosphorous in the form of inorganic fertilizer and manure was applied to agricultural areas in Norway in 2013. Thus, in a “resource perspective in an ideal world” the wastewater sector could potentially cover around 10 per cent of the phosphorous demand in the agricultural sector.
The phosphorous treatment efficiency of the wastewater sector as a whole has been estimated at 68 per cent of the incoming amount. However, there is a big regional variety, and treatment efficiencies are generally higher in counties on the eastern part of the country and in the Trøndelag area, where treatment permits are stricter and recipient capacity is somewhat lower (more sensitive to pollution).
10 per cent increase in costs of wastewater services
In 2014, the total cost for all municipalities was NOK 6.9 billion. This constitutes an increase of 10 per cent compared to 2013. The costs related to the wastewater sector are made up of capital costs and operating costs, and the increase mentioned is due to an increase in both operating and capital costs.
Wastewater fees are determined by the municipalities in accordance with the full cost principle. Local conditions such as patterns of built-up areas, topography, bedrocks in the ground, the need for pumping stations and treatment requirements are all factors behind the variation in fees.
Around half the population live in municipalities with a contribution margin ratio of more than 100 per cent, which means that the incomes from fees are higher than the fee calculation basis. At the same time, a total of 75 per cent of the municipalities have a full cost ratio between 91 and 110 per cent, and these municipalities are home to 80 per cent of the population. Thus, a major part of the population lives in municipalities where the costs for wastewater services are covered by fees. The municipality may then use the surplus to fund provisions or cover earlier deficits.
Contact
-
Gisle Berge
E-mail: gisle.berge@ssb.no
tel.: (+47) 48 12 19 97
