Content
Published:
This is an archived release.
More emission-efficient output in Norway
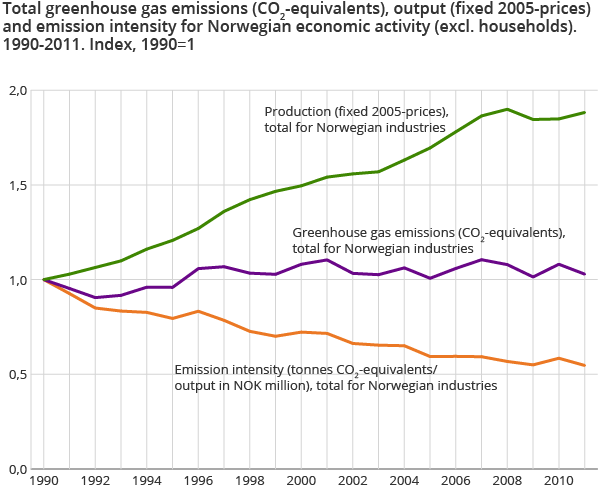
Following a slight increase in 2010, greenhouse gas emissions per produced NOK in Norway fell in 2011. Although the emission intensity has shown an overall decline since 1990, 2011 was one of the few years that experienced both a higher level of economic activity and a fall in greenhouse gas emissions.
Based on more detailed information from the emissions to air accounts and the preliminary national accounts, the total figures for emission intensities for Norwegian economic activity for 2011 have now been revised for the period 1990-2011. These revised figures show a similar trend in emissions of greenhouse gases per produced unit (measured in constant prices) of goods and services as the preliminary estimates published in May 2012. However, there are some revisions at industry level.
Unlike the national emission figures that are reported as part of the Kyotoagreement, and which are calculated using a territorial definition of Norway, the figures presented here also include emissions to air from ocean transport and international air transport in order to link emissions to Norwegian economic activity. The figures are broken down into industries in order to analyse possible correlations between economic growth, energy use and emissions to air, and to identify the various effects causing changes in emissions (decoupling).
The changes in emission intensity in Norway are partly due to technological changes, changes in the mix of energy product used, a shift towards more energy-efficient production and structural changes. A shift from the use of fossil fuels towards fuels based on renewable sources will reduce emissions. This is also the case if there is a structural change in the economy from, for example, manufacturing industries to service industries.
Emission intensity decreased in 2011, following an increase in 2010...
Greenhouse gas emissions related to Norwegian economic activity totalled 60.2 million tonnes of CO 2 equivalents in 2011. This was a decrease of 4.5 per cent compared to 2010.
In 2011, production in the Norwegian economy grew by 1.9 per cent. In contrast to the previous year, this growth was not accompanied by an increase in greenhouse gas emissions. In total for Norway, greenhouse gas intensity in 2011 corresponded to 17.0 tonnes of CO 2 equivalents per NOK million produced. This is a 6.5 per cent decrease from 2010, which roughly corresponds to the historically low level of 2009.
The decrease in the overall emission intensity in 2011 was related to the ocean transport activities, which had an increased production (in constant prices) of 7 per cent that year and a simultaneous decrease in emissions of nearly 20 per cent.
The estimations of the emission from ocean transport are uncertain, particularly the estimations based on the preliminary national accounts’ figures. Looking at the overall emission intensity excluding ocean transport, there was a decrease of 2.9 per cent in 2011. The emission intensity trend, both from 2010 to 2011 and dating back to 1990 is more or less the same.
…but large variations among industries
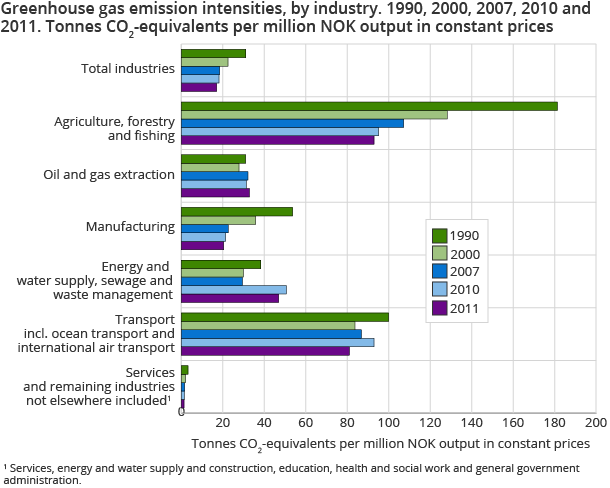
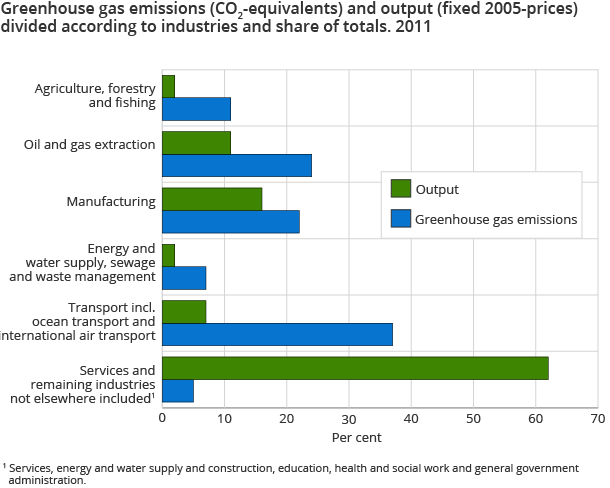
Trends for individual industries show some differences among industries, though nationally the correlation between economic growth and emissions of greenhouse gases seems weak. Service industries, which only make a small contribution to greenhouse gas emissions, produced almost two thirds of the growth in production in 2011 (measured in constant prices).
However, production (at constant prices) also increased in2011 inNorwegian industries that are traditionally more emission intensive, with no corresponding increase in greenhouse gas emissions. This is the case inter alia for the petroleum refining, chemical and pharmaceutical industry and for inland water and costal transport. Production in oil and gas extraction, primary industries and air transport showed higher emission intensities (for more detailed industry figures see Statbank).
Small changes in emission intensity for manufacturing industries and oil and gas extraction
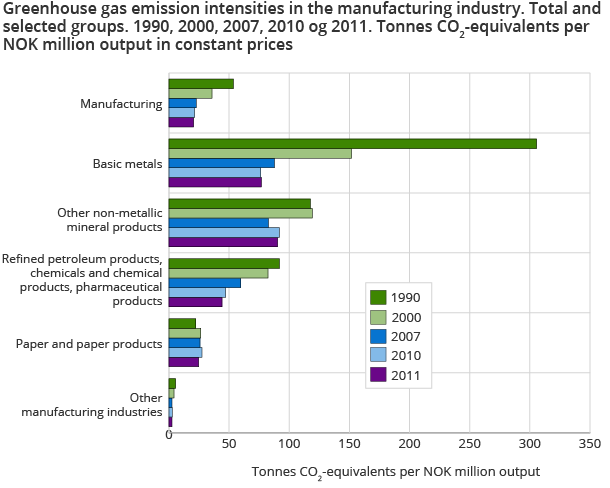
Emission intensity for manufacturing industries decreased by 4.4 per cent in 2011, reaching a level of 20.4 CO2 equivalents per produced unit (as measured in constant 2005 prices). For activities related to oil and gas extraction, emission intensity increased by 4.4 per cent. Greenhouse gas emissions decreased in both the manufacturing and extraction industries in 2011. However, while production (at constant prices) increased in the manufacturing industries, this was not the case for oil and gas extraction.
Since 1990, emission intensity in Norwegian manufacturing has almost halved. This is due to a growth in production in some manufacturing industries with relatively small emission intensities, but also to the fact that industries such as production of metals and petroleum refining, chemicals and pharmaceuticals have improved their emission effectiveness. These industries emit almost three quarters of the total greenhouse gas emissions from manufacturing industries, and have almost a third of the total production.
Emission intensity in the production of oil and gas extraction has seemingly not shown any improvement since 1990, although there were large variations between the different fields. This is related to increased activity in onshore processing and an increasing share of the activity related to gas extraction. The ageing of the oil and gas fields also entails increased emissions per produced unit.
Increase in economic activity overshadows measures to reduce emissions
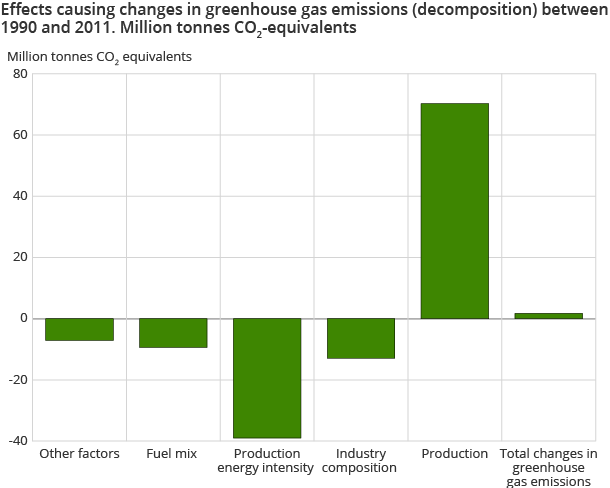
The Norwegian emissions of greenhouse gases have increased by 3 per cent since 1990. Changes in industry composition, energy efficiency and energy intensity reduced the emissions by 74 million tonnes of CO2 equivalents. However, increased production pushed the emissions up by 75 million tonnes.
Decomposition analysisOpen and readClose
The decomposition analysis demonstrates the development of the greenhouse gas emissions as the combined effects of the change in five factors which are the fuel mix (M), production energy intensity (I), industry composition (S), total production value in the Norwegian economy (P) and other factors such as production technology (T).
Additional information
Contact
-
Ingrid Semb Weyer
E-mail: ingrid.semb.weyer@ssb.no
tel.: (+47) 40 90 23 51
-
Trine Heill Braathu Randen
E-mail: trine.heill.braathu.randen@ssb.no
tel.: (+47) 91 10 67 45

