Content
Published:
This is an archived release.
Slight reduction in emissions per produced NOK
The emission intensity for greenhouse gases for the Norwegian economy has steadily decreased since 1990. Preliminary figures for 2013 show that the emission intensity in 2013 has been reduced by 0.6 per cent compared to 2012. This is due to an increase in the emissions of greenhouse gases at almost the same level as the increase in the production in Norwegian industries.
| 2012 | 2013 | Change in per cent | ||
|---|---|---|---|---|
| 2012 - 2013 | Since 1990 | |||
| Output in constant 2005 prices. NOK million | 3 648 697 | 3 709 803 | 1.7 | 97.7 |
| Greenhouse gas emissions. 1 000 tonnes CO2-equivalents | 59 105 | 59 713 | 1.0 | -0.3 |
| Emission intensity for greenhouse gases. Tonnes CO2-equivalents/output in NOK million | 16.1988 | 16.0960 | -0.6 | -49.6 |
![Figure 1. Total greenhouse gas emissions (CO2-equivalents], output (fixed 2005-prices) and emission intensity for Norwegian economic activity (excl. households) Figure 1. Total greenhouse gas emissions (CO2-equivalents], output (fixed 2005-prices) and emission intensity for Norwegian economic activity (excl. households)](/en/natur-og-miljo/statistikker/nrmiljo/aar/_image/215183.png?_encoded=2f66666666666678302f35382f&_ts=14b01f42728)

![Figure 3. Greenhouse gas emissions (CO2-equivalents] and output (fixed 2005-prices) divided according to industries and share of totals. 2013 Figure 3. Greenhouse gas emissions (CO2-equivalents] and output (fixed 2005-prices) divided according to industries and share of totals. 2013](/en/natur-og-miljo/statistikker/nrmiljo/aar/_image/215190.png?_encoded=2f66666666666678302f35382f&_ts=14b071a4890)


Unlike the national emission figures that are reported as part of the Kyoto agreement, and which are calculated using a territorial definition of Norway, the figures presented here also include emissions from maritime transport and international air transport in order to link emissions to Norwegian economic activity.
A small reduction in the emission intensity for the Norwegian economy
The emission intensity for the Norwegian economy is 0.6 per cent lower in 2013 than in 2012 (a decrease of 0.6 per cent). Even though the growth in the Norwegian economy is also positive in 2013, the growth of 1.7 per cent is lower than in 2012. The greenhouse gas emissions (measured in CO2 equivalents) related to this economic activity increased by 1 per cent.
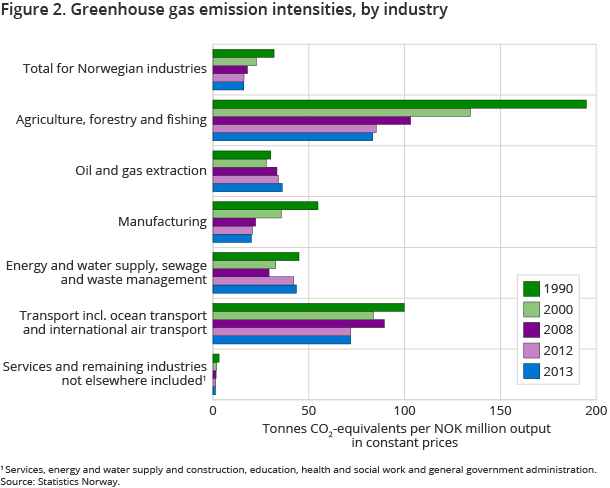
Even though total emissions per produced unit have not changed much between 2012 and 2013, there are more differences in this period at detailed industry level. In 2013, the emission intensity in the oil and gas extraction, land and air transport, production of basic metals and electricity, gas and steam supply increased, while the emission intensity in the production of refined petroleum, chemical and pharmaceutical products declined. The services industries, which do not have an emission intensive production, also saw an increase in value of production in 2013.
Emission intensity in manufacturing industries continues to fall
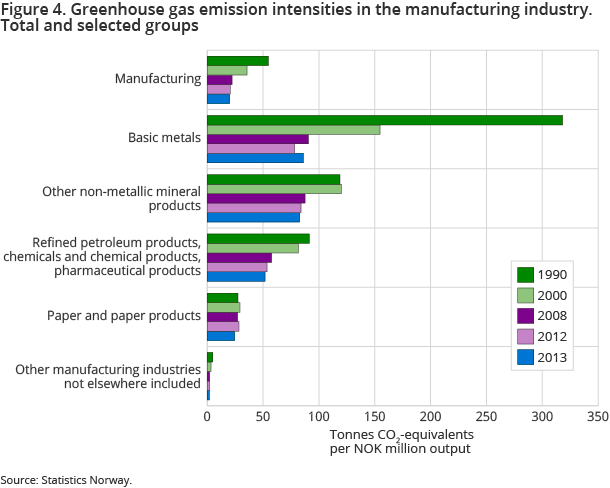
Although the total greenhouse gas emissions from the Norwegian manufacturing industries were almost the same in 2013 as in 2012, the greenhouse gas emission per unit produced (as measured in constant 2005 prices) was reduced. This was due to an increase in production in those manufacturing industries that make a relatively small contribution to the greenhouse gas emissions. In addition, the production of refined petroleum, chemical and pharmaceutical products increased, while at the same time the greenhouse gas emissions were reduced. The decline in the overall emission intensity in the manufacturing industries was curbed by the development in the production of basic metals, where greenhouse gas emissions increased but production (as measured in constant 2005 prices) decreased.
Emission intensity in the oil and gas extraction industry increases
The total greenhouse gas emissions per produced unit of oil and gas (as measured in constant 2005 prices) has increased since 1990. However, there are huge disparities between the different oil and gas fields. Compared to 2012, the total production in the oil and gas extraction industries decreased in 2013. A decrease in the production value is mainly due to lower extraction levels of both oil and gas (measured in oil equivalents). The greenhouse gas emissions were at the same level as in 2012. In 2013, the total greenhouse gas emissions per produced unit of oil and gas therefore also increased.
No change in the emission intensity for the transport sector as a whole
For the transport sector, the picture is complex. The transport sector contains different transport industries with large variations in both the level and development of their emission intensities. In total, the emission intensity was at the same level as in 2012. The production (as measured in constant 2005 prices) actually increased in all the transport industries, but it was only coastal transport that also saw a simultaneous decrease in greenhouse gas emissions.
As in 2012, the emission intensity in the coastal and maritime ocean transport sector decreased, while the opposite is the case for land and air transport.
Estimates of the emissions from maritime ocean transport are uncertain, particularly those based on the preliminary national accounts’ figures. The emission intensity trend dating back to 1990 is more or less the same with or without maritime ocean transport.
Emission intensity for the Norwegian economy has improved since 1990
Total greenhouse gas emissions from Norwegian industries are at the same level in 2013 as in 1990, while the growth of the Norwegian economy has almost doubled (as measured in constant 2005 prices). The emission intensity for greenhouse gases for the Norwegian economy has steadily decreased since 1990 and has been reduced by almost 50 per cent, reaching a level of 16.1 tonnes of CO2 equivalents per produced unit (as measured in constant 2005 prices) in 2013.
The reduced emission intensity in Norway is partly due to technological changes, changes in the mix of energy products used, a shift towards more energy-efficient production and structural changes. A shift from the use of fossil fuels towards fuels based on renewable sources also reduces emissions. This is also the case if there is a structural change in the economy, for example, manufacturing industries to service industries.
Revised emissions and national accounts figuresOpen and readClose
In line with other countries, Norway adheres to the international guidelines on national accounts. These guidelines have recently been updated and include a requirement by the EU's statistical agency, Eurostat, for the European System of National and Regional Accounts 2010 (ESA 2010) to be incorporated into the member states and other EEA countries' national accounts by autumn 2014. Annual growth rates for the total production value at constant prices were only subject to minor adjustments. See annual national accounts for more details.
The greenhouse gas emission figures for the period 1990–2013 are also revised due to revised international guidelines. New sources are included in the estimations, but the total greenhouse gas figures were only subject to minor adjustments due to these new sources. In addition, the GWP for methane has been upward adjusted and the GWP for Nitrous oxide has been downward adjusted and has led to a minor increase in the total greenhouse gas emissions compared to what would have been the case with the old GWP values. See the emission statistics for more details.
The levels of the emission intensities and the annual growth rates were only subject to minor revisions due to the revised emissions and national accounts’ figures.
New StatBank tables for energy use and energy intensities related to Norwegian economic activityOpen and readClose
Statistics Norway also publishes analyses linking energy use to Norwegian economic activity. New figures for the period 2000-2013 are published in StatBank.
Energy use by produced unit, i.e. the energy intensity, measures how much energy is used in the production of goods and services in the Norwegian economy. If the energy intensity is reduced, the energy efficiency of the production is increasing.
The national accounts are used as a source for the figures for the production of goods and services. As for the emission intensities, the definitions, scope and industry breakdowns used in the national accounts are also used when calculating energy intensities. For all industries in the Norwegian economy, the energy intensities are calculated by dividing the energy use (excl. transformation of energy products) in GWh by the value of production (measured in NOK billion) in constant 2005 prices.
Two tables are published in StatBank, one for energy use and one for energy intensities. The table for energy use contains the energy use measure both including and excluding final consumption of energy products as raw materials. Final consumption of energy products used as raw materials are, for example, energy products such as crude oil and natural gas used as input in the production of refined petroleum, chemical and pharmaceutical products.
Additional information
Contact
-
Ingrid Semb Weyer
E-mail: ingrid.semb.weyer@ssb.no
tel.: (+47) 40 90 23 51
-
Trine Heill Braathu Randen
E-mail: trine.heill.braathu.randen@ssb.no
tel.: (+47) 91 10 67 45
