Content
Published:
This is an archived release.
Emissions of sulphur dioxide up 10 per cent
Emissions of sulphur dioxide increased by 10 per cent from 2003 to 2004. The increase is mainly due to increased emissions from iron, steel and ferroalloys production and carbide production. Emissions of particulate matter in Norway decreased by 3 per cent from 2003 to 2004.
This is shown in the preliminary emission figures calculated by Statistics Norway in collaboration with the Norwegian Pollution Control Authority.
The Gothenburg Protocol entered into force on 17 May 2005. According to the Gothenburg Protocol, Norway is committed to ensuring that emissions do not exceed the limits of 22 000 tonnes sulphur dioxide (SO2) per year. The emission ceilings have been negotiated based on critical loads for acid rain and ground-level ozone.
Up 10 per cent
Every year from 1986 to 2002 there has been a decline in the emissions of SO2. Since 2002, however, the emissions have risen to 25 200 tonnes, which is a growth of 3 100 tonnes, or 14 per cent. The emissions have to be reduced by 3 200 tonnes by 2010 in order to reach the target in the Gothenburg protocol. In 2001, the Ministry of the Environment entered into an agreement with the Federation of Norwegian Process Industries to reduce the emissions of SO2 from industrial processes by 2010. Process industries cause the main part of Norwegian SO2 emissions.
| Emission ceiling 2010 according to the Gothenburg Protocol. Status 2004. Tonnes (per cent) |
| Component | Emissions 1990 | Emissions 2004 | Emission ceiling 2010 | Necessary reduction 2004-2010 | |||||||||||||||||||||||||||||||||||
|---|---|---|---|---|---|---|---|---|---|---|---|---|---|---|---|---|---|---|---|---|---|---|---|---|---|---|---|---|---|---|---|---|---|---|---|---|---|---|---|
| Sulphur dioxide (SO2) | 51 904 | 25 191 | 22 000 | 3 200 tonnes (13 per cent) | |||||||||||||||||||||||||||||||||||
Manufacturing industries have the highest emissions
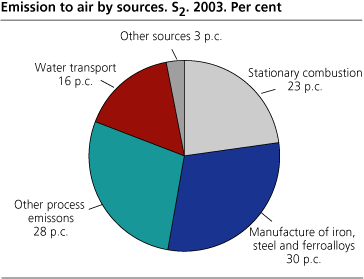
Emissions from manufacturing industries rose by 2 300 tonnes from 2003 to 2004. This was mainly because of increased production of iron, steel and ferroalloys and carbides. 30 per cent of the SO2 emissions in 2004 originated from production of iron, steel and ferroalloys. 28 per cent originated from other industrial processes.
The emissions from stationary combustion (for example heating of buildings) increased by 150 tonnes and contributed to 23 per cent of the total in 2004. Domestic shipping and fishing contributed to 16 per cent. The rest of the SO2 emissions, 3 per cent, came from air and road traffic.
The distribution of the emissions by industry is very uncertain in these preliminary 2004 calculations.
Decrease 1990-2002
Through many years, the SO2 emissions in Norway have dropped as a result of installation of equipment to control emissions at a number of industrial plants (end-of-pipe solutions). A changeover from fossil fuels to electricity, use of lighter oil products, lower sulphur content of oil products and reducing agents are other factors that have contributed to the decrease in SO2 emissions. The Government's extra tax on auto diesel with more than 0.005 per cent sulphur has also given results, since the petroleum companies reduced the sulphur content of auto diesel shortly after the tax was introduced in January 2000. In the period 1990-2002, the SO2 emissions dropped by 57 per cent, but since 2002 they have increased by 14 per cent.
Residential wood burning main source for emissions of particulate matter
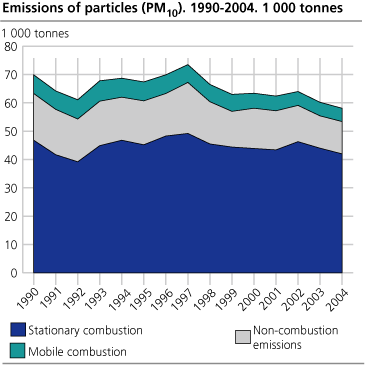
Emissions of particulate matter to air (PM1 0) were estimated at 58 100 tonnes in 2004. Residential wood burning caused almost 70 per cent of the emissions. 7 per cent came from road traffic and road dust. It is, however, important to note that local air quality in the big towns and most densely populated areas is affected by road traffic as much as residential wood burning. See box : The difference between emissions to air and local air quality .
Measures work
Emissions of particulate matter to air were reduced by 17 per cent since 1990. The decrease is a result of less burning of straw and cleaning systems at incineration plants and in manufacturing industries. Less use of studded tyres and restrictions on exhaust emissions from vehicles have also resulted in lower emissions to air.
Emissions from residential wood burning have increased by 6 per cent since 1990 due to the increased use of firewood. Many households have, however, replaced their old, polluting wood stoves with new stoves with cleaner technology. This has had a positive effect on the figures.
|
The difference between emissions to air and local air quality
Particulate matter in the air affects not only the quality of local air but can also be transported to other regions. The emissions have an effect on the climate and contribute to the transport of heavy metals and POPs. However, there is a major difference between emissions to air and local air quality (concentration). This article presents the amount of particulate matter from chimney smoke, exhaust from engines etc., which do not equal local air quality or concentration. When we talk about air quality, we tend to think of what we breathe. From this perspective, road traffic is more important than residential wood burning in terms of generated concentrations of particulate matter. Emissions from residential wood burning are less important, as smoke from chimneys is emitted at a level where humans do not breathe and because it may be transported and diluted by the wind. The concentration of particulate matter from residential wood burning in a region depends on the weather. Exposure to high concentrations of particulate matter, especially from residential wood burning, may have a negative impact on public health. |
Uncertainty
There is a high degree of uncertainty connected to these preliminary calculations.
When estimating emissions of SO2, the distribution of use of heavy oil between on-shore activities and use in ships is very uncertain, and so is the distribution between domestic shipping and international sea transport, based on the sales statistics. This leads to uncertainty in the emission figures. Only emissions from domestic shipping are included in the Gothenburg Protocol.
Emission figures for particulate matter are based on reports from large industrial plants and combustion plants together with calculations based on activity data and emission factors. Considerable uncertainty is attached to the statistics on particulate matter due to variations in reported emission data. It is difficult to measure the emissions. Reported figures may vary a lot from one year to the next although the actual emissions may be on the same level. For emissions based on calculations there are uncertainties in the emission factors, which may be based on only a few measurements. It is also difficult to measure the activity correctly. There are also uncertainties connected to the size of the particles, weather they are TSP, PM1 0 or PM2 . 5.
Earlier this year, Statistics Norway and the Norwegian Pollution Control Authority published figures for the other gases covered by the Gothenburg Protocol. Read more .
Tables
Table 1 Emissions to air by source. 1990
Table 2 Emissions to air by source. 2002
Table 3 Emissions to air by source. 2003
More tables in StatBank .
Other articles on air pollution and greenhouse gases
Emissions of greenhouse gases.1990-2004
Emissions of NOX, NMVOC and ammonia. 1990-2004
The statistics is published with Emissions to air.
Contact
-
Statistics Norway's Information Centre
E-mail: informasjon@ssb.no
tel.: (+47) 21 09 46 42


