Content
Published:
This is an archived release.
216 litres of water a day per person
Norway's municipal water works produced a total of 772 million cubic metres (m3) of water in 2004. Of the water delivered to the households, every person of the household used 216 litres per day. This is an increase of 19 litres compared with 2003.
According to the Water Works Register, Norway had 1 022 water works with around 3.81 million users in 2004. The water works produced 772 million cubic metres of water, corresponding to an average production of 202 m3 per capita. The increase is mainly attributable to natural fluctuations in production, but also to improved reporting since last year.
According to the water works around one third of the production is lost due to leakages in the pipeline system. Households are the main consumers (39 per cent). The remaining water is delivered to the food industry (9 per cent), other industries (9 per cent) and to the agricultural sector and other consumers (9 per cent).
95 per cent have clean water
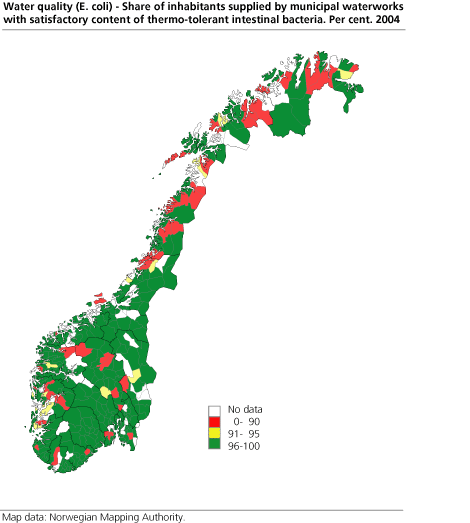
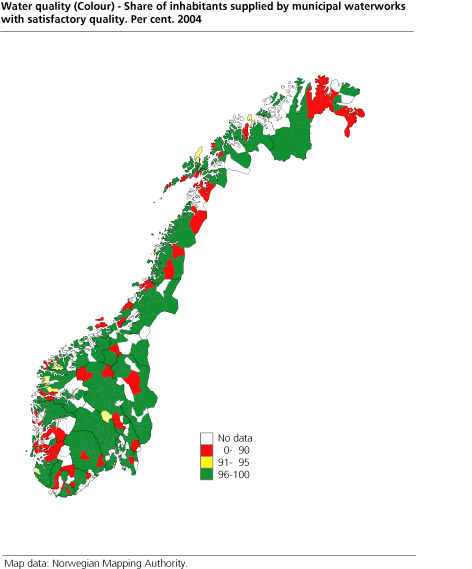
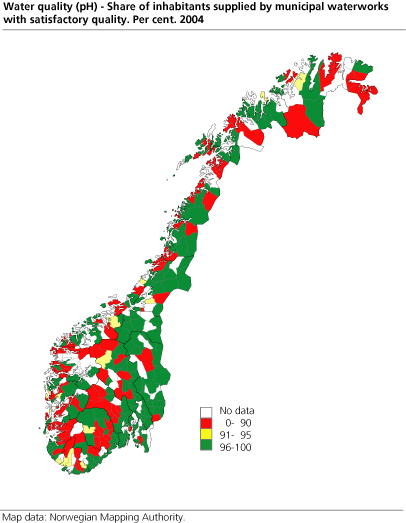
According to the figures, 95 per cent of the people supplied by municipal water works had a satisfactory content of thermo-tolerant intestinal bacteria in their water, while 71 per cent had satisfactory levels of colour and 68 per cent had satisfactory levels of acidity (pH).
The quality of the water varies between the municipalities (see figures 1 to 3). The main cause of negative tests on thermo-tolerant intestinal bacteria in the water is normally lack of treatment facilities in some water works, mainly in western and northern Norway. Two main causes of high acidity in the water are run-off from acidic rocks in mountainous areas and acidic rain in parts of the country. Colour in the water is mainly caused by humus from decomposed organic matter, primarily affecting lower lying areas of the country.
0.48 per cent annual water pipeline renewal
Based on KOSTRA (Municipality-State-Reporting), estimates show that there are around 40 700 kilometres of municipal water pipelines in Norway, of which around 30 per cent were installed in 1970 or earlier. During 2002-2004, the average renewal rate of water pipelines was about 0.48 per cent per year. This equals a lifetime of around 210 years, given the same rate in the future.
Gaps in water fees
In 2005, the fixed annual fee for water consumption is NOK 2 132 on average for the country as a whole. Hedmark county has the highest level (NOK 2 576 on average per year) and Oslo county the lowest (NOK 912 on average per year). When it comes to price per cubic metre of water, Hedmark has the highest price with NOK 11.33 on average and Aust-Agder county the lowest with NOK 5.41 on average. Akershus county has the highest water connection fee (high level) with an average price of NOK 18 326.
See also: KOSTRA: Municipal wastewater
For more information, go to KOSTRA (Municipality-State-Reporting): Municipality activities
Tables:
Contact
-
Gisle Berge
E-mail: gisle.berge@ssb.no
tel.: (+47) 48 12 19 97


