Decline in government financial assets
Published:
General government net financial assets declined by approximately NOK 268 billion in 2018. The reduction is mainly explained by negative returns on the Government Pension Fund’s equity investments.
- Full set of figures
- General government, financial assets and liabilities
By the close of 2018 general net financial assets were NOK 9 918 billion. This constitutes as decline of NOK 268 billion since 2017. While central government net assets exceeded NOK 10 trillion, local government recorded a net debt of NOK 145 billion.
Figure 1. General government net financial assets
| Net financial assets, closing balance | |
| 1996 | 466 |
| 1997 | 595 |
| 1998 | 669 |
| 1999 | 772 |
| 2000 | 1067 |
| 2001 | 1365 |
| 2002 | 1275 |
| 2003 | 1560 |
| 2004 | 1861 |
| 2005 | 2432 |
| 2006 | 2997 |
| 2007 | 3284 |
| 2008 | 3235 |
| 2009 | 3752 |
| 2010 | 4250 |
| 2011 | 4470 |
| 2012 | 5014 |
| 2013 | 6374 |
| 2014 | 7827 |
| 2015 | 8877 |
| 2016 | 9029 |
| 2017 | 10186 |
| 2018 | 9918 |
Asset fluctuations largely driven by the Pension Fund
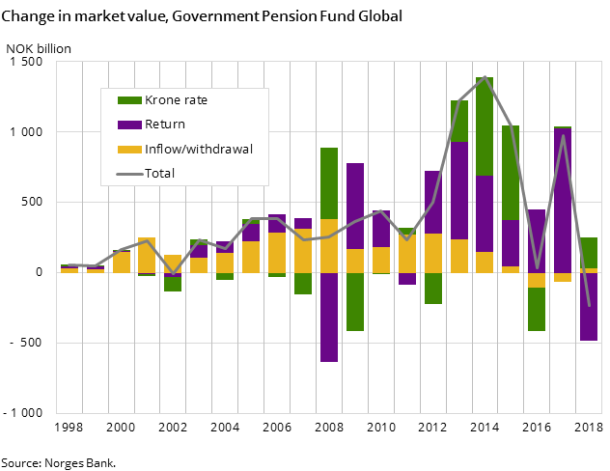
The asset decline owes largely to the reduction of the market value of the Government Pension Fund Global. Despite a weaker krone combined with positive returns on its real estate and fixed income investments, a significantly negative return on its equity investments reduced the Fund’s market value from NOK 8 488 billion to NOK 8 256 billion in 2018.
Because of the Pension Fund’s dominance in government asset holdings, the distribution of investment objects is largely determined by the Fund’s investment strategy. At the end of 2018 the Fund’s asset allocation was 66.3 per cent equities, 3.0 per cent unlisted real estate and 30.7 per cent fixed income.
Figure 2. Central government financial assets
| Q1-2010 | Q2-2010 | Q3-2010 | Q4-2010 | Q1-2011 | Q2-2011 | Q3-2011 | Q4-2011 | Q1-2012 | Q2-2012 | Q3-2012 | Q4-2012 | Q1-2013 | Q2-2013 | Q3-2013 | Q4-2013 | Q1-2014 | Q2-2014 | Q3-2014 | Q4-2014 | Q1-2015 | Q2-2015 | Q3-2015 | Q4-2015 | Q1-2016 | Q2-2016 | Q3-2016 | Q4-2016 | Q1-2017 | Q2-2017 | Q3-2017 | Q4-2017 | Q1-2018 | Q2-2018 | Q3-2018 | Q4-2018 | |
| Shares | 2311.872 | 2202.668 | 2330.238 | 2529.532 | 2569.458 | 2489.571 | 2260.940 | 2568.025 | 2788.571 | 2707.534 | 2886.004 | 2956.944 | 3276.540 | 3393.399 | 3673.367 | 3852.985 | 3895.608 | 4171.144 | 4176.663 | 4683.901 | 5205.906 | 5160.073 | 4959.427 | 5360.817 | 5007.656 | 5080.998 | 5110.871 | 5569.772 | 5909.397 | 6043.467 | 6170.337 | 6668.413 | 6396.115 | 6658.873 | 6874.295 | 6478.023 |
| Long term bonds | 1197.055 | 1288.516 | 1306.756 | 1326.045 | 1324.403 | 1301.370 | 1427.333 | 1400.822 | 1377.622 | 1450.912 | 1516.262 | 1521.819 | 1575.358 | 1654.387 | 1704.887 | 1932.700 | 1985.729 | 2112.034 | 2109.047 | 2399.513 | 2531.773 | 2464.775 | 2688.943 | 2738.398 | 2712.368 | 2811.591 | 2692.516 | 2716.719 | 2712.174 | 2752.270 | 2639.765 | 2717.768 | 2651.797 | 2668.542 | 2645.161 | 2669.435 |
| Loans | 654.758 | 697.667 | 693.279 | 718.627 | 767.656 | 824.330 | 722.108 | 519.222 | 578.311 | 582.837 | 579.729 | 541.428 | 616.207 | 617.095 | 663.007 | 613.180 | 595.591 | 576.532 | 581.809 | 562.238 | 589.153 | 609.357 | 675.133 | 657.715 | 657.708 | 679.256 | 671.993 | 670.157 | 727.385 | 693.548 | 721.041 | 729.215 | 792.621 | 764.525 | 758.167 | 812.182 |
| Other accounts receivable | 698.496 | 757.440 | 771.219 | 682.448 | 757.200 | 746.728 | 835.887 | 660.896 | 766.569 | 773.952 | 767.164 | 743.170 | 820.323 | 809.744 | 796.168 | 746.582 | 831.535 | 816.532 | 829.788 | 897.770 | 982.613 | 941.765 | 968.516 | 951.240 | 991.800 | 986.305 | 992.845 | 982.621 | 1104.654 | 1070.126 | 1038.351 | 1033.062 | 1054.738 | 1082.588 | 1100.880 | 1114.496 |
The large nominal changes in government assets are mainly driven by exchange rate fluctuations and the government’s equity investments. These fluctuations can amount to hundreds of billions in the course of a quarter. The Pension Fund suffered a negative return of NOK 485 billion on its investments, while a depreciation of the krone resulted in an exchange rate gain of NOK 224 billion. Meanwhile, central government surplus increased so as to allow for a net transfer to the Fund.
Continual growth in local government debt
Local government debt has increased sharply since the turn of the millennium. The increase is mainly due to large-scale investments in the municipalities. Investments have been the highest in areas such as road projects, compulsory schooling, health care, public housing, and water and sewerage. The debt grew somewhat more slowly in 2016 and 2017 than in the preceding years, but accelerated again in 2018, growing by 5.3 per cent.
Contact
-
Frode Borgås
-
Eivind Andreas Sirnæs Egge
-
Christopher Okazaki Hansen
-
Statistics Norway's Information Centre

