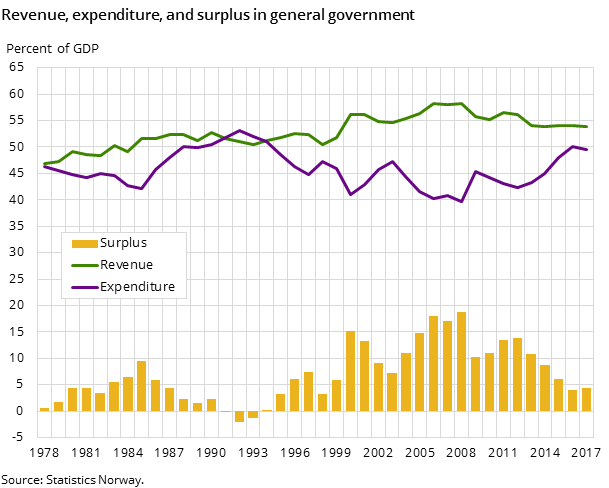
First rise in surplus since 2012
Published:
General government surplus is estimated at NOK 146 billion in 2017. This is the first time since 2012 that general government surplus grows from one year to the next.
- Full set of figures
- General government revenue and expenditure
Preliminary figures show a NOK 21 billion growth in general government surplus after a yearly decline since 2012. The surplus equals 4.4 per cent of GDP - the second lowest since the turn of the millennium.
NOK 164 billion surplus in central government
Central government surplus is estimated at NOK 164 billion, about NOK 27 billion larger than in 2016. The increase can in large part be attributed to increased revenue stemming from petroleum extraction through taxes, dividends from Statoil, and operational surplus from the State’s Direct Financial Interest (SDFI). These make up about 13 per cent of total central government revenue.
Benefits to households, central government’s largest expenditure item, add up to NOK 520 billion in 2017. These comprise pensions and other cash benefits through the National Insurance Scheme, as well as benefits in kind such as reimbursements for medicines and medical services. Transfers, mainly to local government, and subsidies to private business is the second largest item, and records a total of NOK 373 billion.
Larger deficit in local government
Unlike central government, local government runs a deficit. Preliminary figures show a NOK 18 billion deficit, an increase of NOK 5 billion compared to 2016. Reduced growth in accrued tax revenues accounts significantly for the increased deficit. Tax revenues from income and capital are estimated at NOK 183 billion, only 1 percent higher than in 2016. In 2015 and 2016 local government recorded unusually high tax receipts stemming from a rise in taxable income from dividends. This increase was a response to the anticipated rise in dividends tax introduced in 2016. While the deficit consequently diminished during these years, it has again risen in 2017.
Increased expenditure adds to the deficit. The largest expenditure items are employee compensation, use of goods and services, and investment in fixed capital. Employee compensation and use of goods and services combined are estimated at NOK 382 billion, a 5 per cent increase from the previous year. Investment in fixed capital is estimated at NOK 74 billion, also an increase of little over 5 per cent from 2016. Investment in the education sector is the largest sub-item, recording a 15 per cent growth.
The most important source of revenue for the local government is transfers from the central government, which increased by 6 per cent from 2016. This contribution from the central government helped slow the deficit, all else equal. The real estate tax receipts stand out among the tax items with a NOK 1.4 billion increase from last year, which constitutes 12 per cent. This high increase stems from an extended range of properties on which the municipalities levy the tax. More on the real estate tax can be found here.
Figure 2. Expenditure in central and local government
| Central government | Local government | |
| Employee compensationand use of goods andservices | 312.9 | 382.3 |
| Social benefits | 521.1 | 45.3 |
| Interest, subsidies and transfers | 381.6 | 51.1 |
| Investments in non-financial assets | 103.2 | 72.4 |
Contact
-
Aina Johansen
-
Eivind Andreas Sirnæs Egge
-
Frode Borgås
-
Statistics Norway's Information Centre


