Increased surplus
Published:
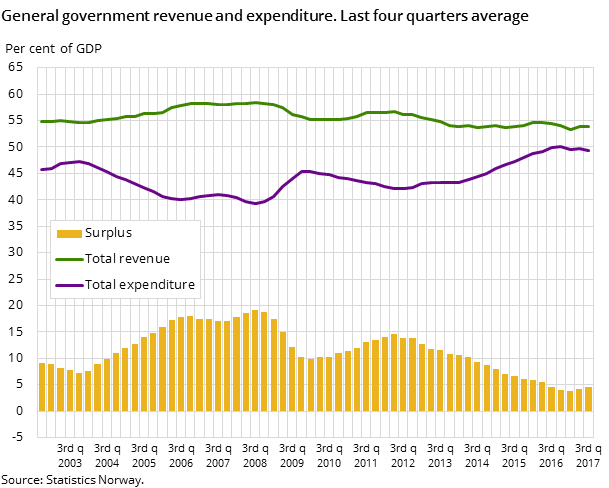
General government surplus is estimated at NOK 148 billion in the last four quarters. This constitutes an increase of about NOK 8 billion compared to the corresponding period last year.
- Full set of figures
- General government revenue and expenditure
- Series archive
- General government revenue and expenditure (archive)
General government surplus, as measured by net lending, has increased in the last two quarters. This rise follows five years of a declining surplus, and is primarily due to an increase in revenue from petroleum extraction. Furthermore, the increase in general government expenditure has now slowed compared to the years 2013-2015. In this period, expenditure grew at about 6 per cent per annum. Since 2015, the growth rate has slowed to 4 per cent.
Mainly petroleum
As central government revenue from petroleum extraction began to increase markedly in the late 1990s, the yearly surplus eventually reached very high levels. In the period spanning 2005-2014, the surplus constituted about 14 per cent of GDP on average; a notably high share both historically and internationally. By 2016, this surplus had fallen to below 5 per cent, partly as a result of reduced petroleum prices.
A significant share of the central government’s revenues stem from the petroleum sector, and fluctuations in central government surplus can often be attributed to circumstances pertaining to this sector. Since the establishment of the Government Pension Fund Global, revenues from petroleum extraction are transferred to the Fund, thus adding to net lending. At the same time, the government fiscal rule ensures that the spending of these revenues, while reducing net lending, is evened out in the public budgets. Thus, developments in government surplus will closely track those of petroleum revenue, as illustrated in figure 2.
Figure 2. Petroleum revenue and surplus in central government. Annual data
| Petroleum revenue | Surplus | |
| 1978 | 6.0 | 1.6 |
| 1979 | 9.9 | 5.5 |
| 1980 | 23.0 | 16.5 |
| 1981 | 26.2 | 17.7 |
| 1982 | 29.3 | 15.3 |
| 1983 | 35.0 | 27.7 |
| 1984 | 43.0 | 33.4 |
| 1985 | 51.2 | 50.5 |
| 1986 | 19.4 | 31.7 |
| 1987 | 12.4 | 30.0 |
| 1988 | 4.4 | 21.3 |
| 1989 | 18.5 | 16.3 |
| 1990 | 33.9 | 16.0 |
| 1991 | 35.4 | -0.3 |
| 1992 | 32.9 | -16.5 |
| 1993 | 35.5 | -15.0 |
| 1994 | 37.4 | -1.8 |
| 1995 | 39.7 | 30.8 |
| 1996 | 69.9 | 66.6 |
| 1997 | 78.6 | 86.7 |
| 1998 | 39.5 | 53.6 |
| 1999 | 64.2 | 84.5 |
| 2000 | 196.2 | 232.8 |
| 2001 | 187.2 | 217.1 |
| 2002 | 159.8 | 140.3 |
| 2003 | 169.1 | 133.3 |
| 2004 | 218.6 | 205.1 |
| 2005 | 296.6 | 295.1 |
| 2006 | 361.3 | 400.5 |
| 2007 | 314.1 | 412.7 |
| 2008 | 422.3 | 514.0 |
| 2009 | 263.1 | 274.5 |
| 2010 | 291.8 | 307.6 |
| 2011 | 369.7 | 395.0 |
| 2012 | 397.2 | 427.7 |
| 2013 | 333.3 | 354.5 |
| 2014 | 290.4 | 298.5 |
| 2015 | 185.7 | 198.7 |
| 2016 | 134.1 | 136.6 |
Contact
-
Aina Johansen
-
Eivind Andreas Sirnæs Egge
-
Frode Borgås
-
Statistics Norway's Information Centre


