Reduced expenditure growth
Published:
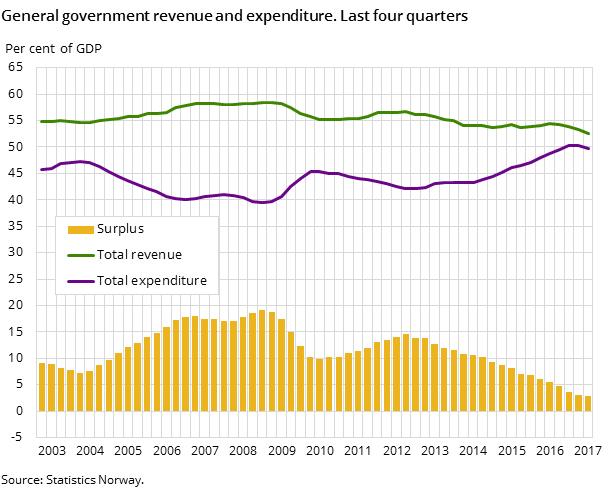
After a period with a relatively strong increase in general government expenditure, growth is now below 5 per cent for the second consecutive quarter.
- Full set of figures
- General government revenue and expenditure
- Series archive
- General government revenue and expenditure (archive)
Total expenditure in central and local government is estimated at NOK 394 billion in the first quarter of 2017. In the last four quarters, expenditure has increased by 4.6 per cent compared to the equivalent period last year. This is the second consecutive quarter that expenditure growth is lower than 5 per cent. By comparison, growth was 6 per cent on average in the period 2013-2015.
Reduced taxes for personal taxpayers
Revised figures for fiscal year 2016 show that taxes from Mainland Norway totalled NOK 1136 billion. This equals an increase of less than 2 per cent from the previous year. This relatively small increase is due partly to lower tax revenues from personal taxpayers – which can be partly explained by the lowering of the net tax rate on income for personal tax payers that took place from 2016. Furthermore, tax revenues were relatively high in 2015 because taxable income from dividends doubled. This spike was arguably an adjustment in response to the anticipated rise in the tax on dividends introduced in 2016.
Figure 2. Taxes from Mainland-Norway
| 2014 | 2015 | 2016 | |
| Real estate tax | 0.38 | 0.43 | 0.45 |
| Tax on net wealth, inheritance and gifts | 0.64 | 0.49 | 0.5 |
| Energy and pollution taxes | 0.84 | 0.87 | 0.95 |
| Taxes on alcohol and tobacco | 1.14 | 1.1 | 1.08 |
| Taxes on motor vehicles | 1.88 | 1.75 | 1.63 |
| Income tax corporations | 2.85 | 2.61 | 2.54 |
| Employees' social security contributions | 5 | 5.15 | 5.07 |
| Employers' social security contributions | 7.36 | 7.3 | 7.12 |
| Value added tax and customs duties | 10.13 | 10.26 | 10.38 |
| Income tax personal taxpayers | 12.23 | 12.74 | 12.09 |
Social protection constitutes 40 per cent
Government expenditure by purpose, or function, shows that 40 per cent of total expenditure is classified in the category of social protection. This category includes social benefits organised through the National Insurance Scheme. The second largest category, with a share of 17 per cent of total expenditure, is health – the category that includes all public hospitals.
Figure 3. Total expenditure by function. 2016
| Central government | Local government | |
| Housing and community amenities | 0.58 | 25.37 |
| Environment protection | 6.45 | 21.63 |
| Public order and safety | 30.27 | 5.73 |
| Recreation, culture and religion | 17.84 | 29.39 |
| Defence | 48.3 | 0 |
| General public services | 95.29 | 43.66 |
| Economic affairs | 116.25 | 48.17 |
| Education | 51.54 | 123.67 |
| Health | 194.39 | 73.49 |
| Social protection | 483.43 | 150.59 |
-
More tables and numbers about General government revenue and expenditure
Contact
-
Aina Johansen
-
Eivind Andreas Sirnæs Egge
-
Frode Borgås
-
Statistics Norway's Information Centre

