Content
Published:
This is an archived release.
Net financial assets increase despite stock market loss
At the end of 2011, general government net financial assets increased by NOK 187 billion to NOK 4 354 billion.
General government’s financial assets amounted to NOK 5 284 billion; a decrease of NOK 136 billion from 2010. General government debt amounted to NOK 930 billion at the end of 2011. This corresponds to a decrease of NOK 323 billion from 2010. The decrease in financial assets and liabilities is largely explained by the scope of repurchase agreements in the Government Pension Fund Global, which fell significantly in 2011.
General government’s portfolio of financial assets was dominated by shares, which constituted 53 per cent, while long-term bonds and loans (receivable) amounted to 27 per cent and 11 per cent respectively.
Central government suffers heavy losses in the stock market
The negative return on shares in 2011 was considerable, with losses amounting to NOK 207 billion. In comparison, the central government gained NOK 207 billion on its investments in shares in 2010. Nevertheless, substantial cash flow from petroleum activity - the highest since 2008 - contributed to large net investments in financial assets. In 2011, central government net bought long-term shares for NOK 243 billion. In 2010, the net acquisition of shares amounted to NOK 76 billion.
Deficit in local government
Local government’s deficit, measured by net lending, totalled NOK 20 billion for 2011. The operating deficit is reflected by increased loans (payable) in the local government accounts.
Local government’s total liabilities constituted NOK 396 billion, while total assets were valued at NOK 246 billion.
General government’s gross public debt
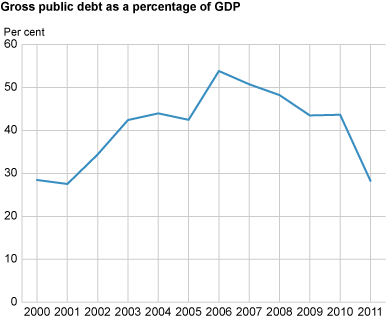
One of the main criteria of the Treaty of the European Union (TEU) is that a country’s gross public debt should not exceed 60 per cent of its gross domestic product (GDP). Gross public debt, as defined in the TEU, is often used in international comparisons. It includes gross debt from bonds, loans, certificates, commercial papers and treasury bills, measured at face value and consolidated for debt between different units within general government.
In 2011, gross public debt, according to the EU’s definition, totalled NOK 778 billion, or 28.3 per cent of GDP.
| Year | Gross public debt. Face value | Gross domestic product | Gross public debt as a percentage of GDP | ||||||||||||||||||||||||||||||||||||||||||||||||||||||||||||||||||||||||||||
|---|---|---|---|---|---|---|---|---|---|---|---|---|---|---|---|---|---|---|---|---|---|---|---|---|---|---|---|---|---|---|---|---|---|---|---|---|---|---|---|---|---|---|---|---|---|---|---|---|---|---|---|---|---|---|---|---|---|---|---|---|---|---|---|---|---|---|---|---|---|---|---|---|---|---|---|---|---|---|---|
| 2000 | 421 918 | 1 481 242 | 28.5 | ||||||||||||||||||||||||||||||||||||||||||||||||||||||||||||||||||||||||||||
| 2001 | 423 305 | 1 536 887 | 27.5 | ||||||||||||||||||||||||||||||||||||||||||||||||||||||||||||||||||||||||||||
| 2002 | 527 450 | 1 532 307 | 34.4 | ||||||||||||||||||||||||||||||||||||||||||||||||||||||||||||||||||||||||||||
| 2003 | 675 588 | 1 592 201 | 42.4 | ||||||||||||||||||||||||||||||||||||||||||||||||||||||||||||||||||||||||||||
| 2004 | 770 909 | 1 752 812 | 44.0 | ||||||||||||||||||||||||||||||||||||||||||||||||||||||||||||||||||||||||||||
| 2005 | 832 163 | 1 958 907 | 42.5 | ||||||||||||||||||||||||||||||||||||||||||||||||||||||||||||||||||||||||||||
| 2006 | 1 174 115 | 2 180 801 | 53.8 | ||||||||||||||||||||||||||||||||||||||||||||||||||||||||||||||||||||||||||||
| 2007 | 1 170 452 | 2 306 445 | 50.7 | ||||||||||||||||||||||||||||||||||||||||||||||||||||||||||||||||||||||||||||
| 2008 | 1 234 651 | 2 559 914 | 48.2 | ||||||||||||||||||||||||||||||||||||||||||||||||||||||||||||||||||||||||||||
| 2009 | 1 024 751 | 2 382 330 | 43.0 | ||||||||||||||||||||||||||||||||||||||||||||||||||||||||||||||||||||||||||||
| 2010 | 1 094 159 | 2 544 266 | 43.0 | ||||||||||||||||||||||||||||||||||||||||||||||||||||||||||||||||||||||||||||
| 2011 | 778 083 | 2 749 963 | 28.3 | ||||||||||||||||||||||||||||||||||||||||||||||||||||||||||||||||||||||||||||
Liabilities connected to the Government Pension Fund GlobalRepurchase agreements and re-sale agreements in securities are instruments that are frequently used in the administration of the Government Pension Fund Global. The fund sells a portfolio of securities accompanied by a repurchase agreement. However, in the accounts, the portfolio remains on the asset side of the fund’s balance sheet, as does the cash received for the sale. The corresponding sales value is then entered as a loan from the buyer on the liability side of the balance sheet. The reverse situation is called a re-sale agreement or a reversed repo. The European System of Accounts (ESA) requires re-purchase agreements to be included in the balance category loans. This means that liabilities associated with repos in the Government Pension Fund Global are included in the official estimation of Norway’s gross debt. As repurchase agreements inflate both sides of the balance sheet, the gross debt, calculated according to ESA, presents a misleading picture of the financial situation of the general government in Norway. |
Tables:
This page has been discontinued, see General government, financial assets and liabilities, Quarterly.
Additional information
Contact
-
Jostein Birkelund
E-mail: jostein.birkelund@ssb.no
tel.: (+47) 40 90 26 55
-
Achraf Bougroug
E-mail: achraf.bougroug@ssb.no
tel.: (+47) 40 90 26 15
-
Frode Borgås
E-mail: frode.borgas@ssb.no
tel.: (+47) 40 90 26 52

