Content
Published:
This is an archived release.
Large financial gains for general government
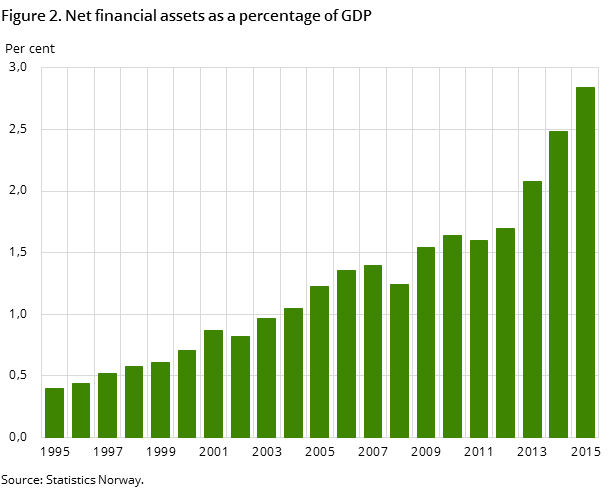
General government’s net financial assets amounted to NOK 8 880 billion at the end of 2015, which is a 13 per cent increase from the previous year.
| 2014 | 2015 | |||
|---|---|---|---|---|
| Stocks per 31.Dec | Transactions | Other change | Stocks per 31.Dec | |
| Assets | ||||
| Currency and Deposits | 227 718 | -14 416 | 1 382 | 214 684 |
| Bonds | 2 415 245 | 143 609 | 226 285 | 2 785 139 |
| Loans | 638 794 | 89 620 | 8 586 | 737 000 |
| Shares and other equity | 5 233 306 | 136 560 | 607 053 | 5 976 919 |
| Insurance technical reserves | 64 447 | 4 390 | 2 606 | 71 443 |
| Other accounts receivable | 296 272 | -4 231 | 370 | 292 411 |
| TOTAL ASSETS | 8 875 782 | 355 532 | 846 282 | 10 077 596 |
| Liabilities | ||||
| Bonds | 483 734 | 30 556 | -5 519 | 508 771 |
| Loans | 393 283 | 118 619 | 744 | 512 646 |
| Oher accounts payable | 159 216 | 17 794 | -1 083 | 175 927 |
| TOTAL LIABILITIES | 1 036 233 | 166 969 | -5 858 | 1 197 344 |
| Net financial assets | 7 839 549 | 8 880 252 | ||
| Net lending | 188 563 | |||
| Net revaluations | 852 140 | |||


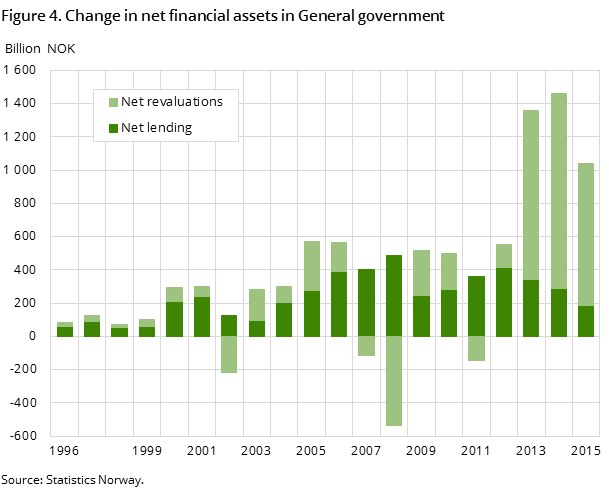
The net financial assets increased despite reduced income from petroleum taxes and petroleum activities. Net lending accounts for about 20 per cent of the growth in financial assets in 2015. The remaining 80 per cent was due to capital gains and gains from the depreciation of the NOK. These gains also account for about 80 per cent of the total growth for the last three years combined.
Investments in the Government Pension Fund Global account for a large share of the general government’s financial assets. Because the fund only invests abroad, its value measured in NOK is sensitive to exchange rate fluctuations. The NOK has depreciated compared to the USD and the EUR in the years since 2012. Much of the growth in total assets, measured in NOK, has been due to this depreciation.
Increase in shares and bonds
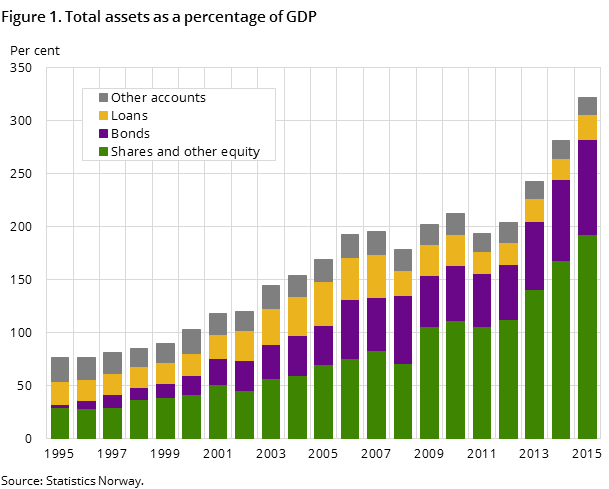
Shares account for 54 per cent and bonds account for 28 per cent of the total assets at the end of 2015. These percentages have been increasing for the whole period covered by the statistics. The increase can partly be explained by growth in the Government Pension Fund Global, which has increased its investments in shares and bonds in recent years.
Increased gross debt
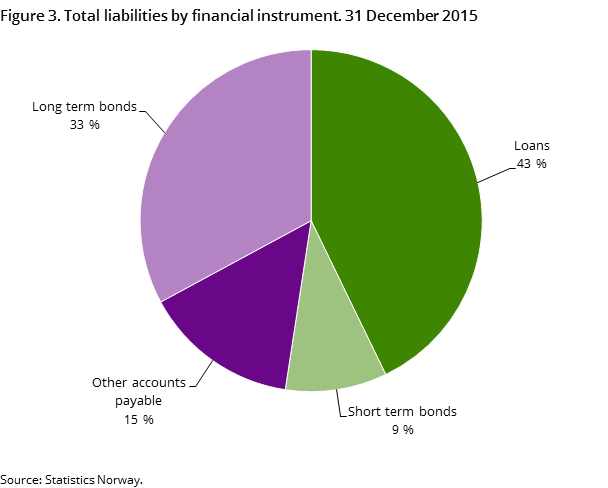
At the end of 2015, general government’s gross debt was 32 per cent of GDP. This is somewhat higher than in 2014 when it was 27 per cent. The increase is due to higher local government debt, increased liabilities connected to the Government Pension Fund Global repurchase agreements and reduced GDP growth from 2014 to 2015.
This page has been discontinued, see General government, financial assets and liabilities, Quarterly.
Additional information
Contact
-
Jostein Birkelund
E-mail: jostein.birkelund@ssb.no
tel.: (+47) 40 90 26 55
-
Achraf Bougroug
E-mail: achraf.bougroug@ssb.no
tel.: (+47) 40 90 26 15
-
Frode Borgås
E-mail: frode.borgas@ssb.no
tel.: (+47) 40 90 26 52
