Content
Published:
This is an archived release.
Improved net financial assets
Net financial assets in general government at the end of 2000 came to NOK 8831 billion, a rise of NOK 2331 billion, or 36 per cent, from 1999. General governments total financial assets increased with nearly 33 per cent from 1999, and amounted to NOK 1 535 billion at the end of 2000.
The growth in general government net financial assets is primarily caused by increased financial assets in central government. This is partly a result of large allocations to the Government Petroleum Fund and partly because the Fund enjoyed high yields during the year. This is expressed through the increase in net financial assets in other central government accounts, which in 2000 rose by NOK 173.4 billion.
In addition to the increase in net financial assets in other central governments accounts, net financial assets in the central government fiscal accounts including National Insurance Scheme increased by NOK 11.61 billion.
For local government there is a positive change in net financial assets despite the high deficit before financial transactions.
Between 1999 and 2000, there was a considerable increase in the total liabilities of NOK 1451 billion. The Government Petroleum Fund entering repurchase agreements due to securities mainly causes this increase.
Gross public debt
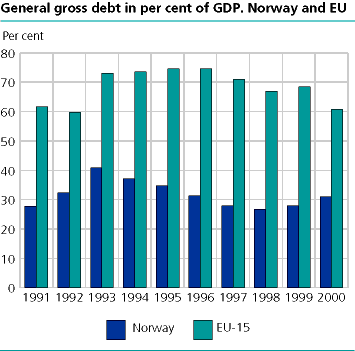
The Maastricht Treaty definition is usually used in international comparisons of gross public debt. The definition includes neither other account payable nor internal liabilities in general government. According to this delimitation, Norway's public debt is 31 per cent of gross domestic product (GDP) at the end of 2000. This is the second lowest in the EU after Luxembourg, whose gross dept is only about 6 per cent of GDP. Average for the 15 EU Member Countries at 31 December 2000 was 60.8 per cent.
Since 1993 the average gross debt has fallen relative to GDP in the European Economic Area (EEA). This trend was particularly obvious for Norway, whose gross dept has been reduced over a period: From 40.8 per cent of GDP in 1993 to 26.8 per cent of GDP in 1998. In 2000, the public dept has risen to 31 per cent of GDP.
| 1 | Figures are corrected 12.2.2002 at 1030 a.m. |
|
General government. Financial balance sheet. Nominal value.
Billion kroner and change in per cent |
| Billion kroner | Change in per cent | ||||||||||||||||||||||||||||||||||||||
|---|---|---|---|---|---|---|---|---|---|---|---|---|---|---|---|---|---|---|---|---|---|---|---|---|---|---|---|---|---|---|---|---|---|---|---|---|---|---|---|
| 1999 | 2000 | ||||||||||||||||||||||||||||||||||||||
| A. Financial assets total | 1 156,2 | 1 535,1 | 32,8 | ||||||||||||||||||||||||||||||||||||
| Cash and deposits | 128,3 | 194,4 | 51,5 | ||||||||||||||||||||||||||||||||||||
| Commercial papers and bonds | 181,2 | 293,9 | 62,2 | ||||||||||||||||||||||||||||||||||||
| Other loans | 344,1 | 422,4 | 22,8 | ||||||||||||||||||||||||||||||||||||
| Capital deposits and shares | 356,7 | 431,2 | 20,9 | ||||||||||||||||||||||||||||||||||||
| Other financial assets | 143,8 | 191,3 | 33,0 | ||||||||||||||||||||||||||||||||||||
| B. Liabilities, total | 506,4 | 651,81 | 28,71 | ||||||||||||||||||||||||||||||||||||
| Commercial papers and Treasury bills | 42,1 | 36,6 | -13,1 | ||||||||||||||||||||||||||||||||||||
| Bonds | 156,5 | 176,11 | 12,51 | ||||||||||||||||||||||||||||||||||||
| Other loans | 239,4 | 349,2 | 45,9 | ||||||||||||||||||||||||||||||||||||
| Other liabilities | 68,4 | 89,91 | 31,41 | ||||||||||||||||||||||||||||||||||||
| C. Net financial assets (A-B) | 649,8 | 883,31 | -2 | ||||||||||||||||||||||||||||||||||||
| General gross debt | 330,8 | 440,51 | 33,21 | ||||||||||||||||||||||||||||||||||||
| Per cent of GDP | 27,9 | 31,0 | -2 | ||||||||||||||||||||||||||||||||||||
| 1 | Figures are corrected 12.2.2002 at 1030 a.m. |
| 2 | Corrected 11.01.2006. |
This page has been discontinued, see General government, financial assets and liabilities, Quarterly.
Additional information
Contact
-
Jostein Birkelund
E-mail: jostein.birkelund@ssb.no
tel.: (+47) 40 90 26 55
-
Achraf Bougroug
E-mail: achraf.bougroug@ssb.no
tel.: (+47) 40 90 26 15
-
Frode Borgås
E-mail: frode.borgas@ssb.no
tel.: (+47) 40 90 26 52

