Content
Published:
This is an archived release.
Slight increase in net financial assets
Net financial assets in general government at the end of 2002 came to nearly NOK 1 104 billion, a small increase of 5.8 billion, or 0.5 per cent, from 2001. At the end of 2002, general governments total financial assets had increased by 8.2 per cent and amounted to NOK 1 934 billion, and total liabilities had increased by 20.3 per cent and amounted to NOK 831billion.
In addition, the net financial assets in the central government fiscal account including National Insurance Scheme decreased from 211.3 billion in 2001 to 192.4 billion in 2002.
In 2002 the net financial assets decreased by NOK 10.3 billion in other central government accounts, from 754 billion in 2001 to 744 billion in 2002.
According to local government assets and liabilities, there was a financial improvement in 2002, with a decrease in net financial debt corresponding to NOK 23 billion - from NOK 35.4 billion in 2001 to NOK 12.2 billion in 2002.
Gross public debt
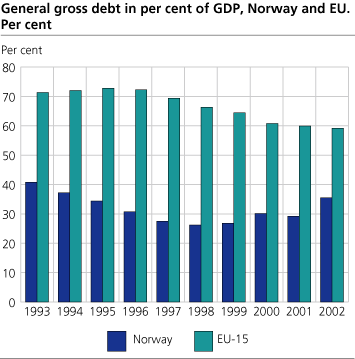
The Maastricht Treaty definition is usually used in international comparisons of gross public debt. The definition includes neither other account payable nor internal liabilities in general government. According to this delimitation, Norway's public debt is 35.5 per cent of gross domestic product (GDP) at the end of 2002. Average for the 15 EU Member Countries at the end of 2002 was 59.2 per cent, according to figures from the OECD.
|
General government. Financial balance sheet. Nominal value.
NOK billion and change in per cent |
| NOK billion | Change in per cent | ||||||||||||||||||||||||||||||||||||||
|---|---|---|---|---|---|---|---|---|---|---|---|---|---|---|---|---|---|---|---|---|---|---|---|---|---|---|---|---|---|---|---|---|---|---|---|---|---|---|---|
| 2001 | 2002 | ||||||||||||||||||||||||||||||||||||||
| A. Financial assets total | 1 788.0 | 1 934.2 | 8.2 | ||||||||||||||||||||||||||||||||||||
| Cash and deposits | 171.9 | 142.6 | -17.0 | ||||||||||||||||||||||||||||||||||||
| Commercial papers and bonds | 402.7 | 445.8 | 10.7 | ||||||||||||||||||||||||||||||||||||
| Other loans | 500.5 | 615.3 | 22.9 | ||||||||||||||||||||||||||||||||||||
| Capital deposits and shares | 512.2 | 512.3 | 0.0 | ||||||||||||||||||||||||||||||||||||
| Other financial assets | 199.2 | 216.4 | 8.6 | ||||||||||||||||||||||||||||||||||||
| B. Liabilities, total | 690.4 | 830.7 | 20.3 | ||||||||||||||||||||||||||||||||||||
| Commercial papers and Treasury bills | 41.5 | 56.4 | 35.9 | ||||||||||||||||||||||||||||||||||||
| Bonds | 161.5 | 152.5 | -5.6 | ||||||||||||||||||||||||||||||||||||
| Other loans | 383.4 | 499.3 | 30.2 | ||||||||||||||||||||||||||||||||||||
| Other liabilities | 103.8 | 122.5 | 18.0 | ||||||||||||||||||||||||||||||||||||
| C. Net financial assets (A-B) | 1 097.6 | 1 103.5 | -1 | ||||||||||||||||||||||||||||||||||||
| General gross debt | 446.0 | 543.8 | 21.9 | ||||||||||||||||||||||||||||||||||||
| Per cent of GDP | 29.2 | 35.5 | -1 | ||||||||||||||||||||||||||||||||||||
| 1 | Corrected 11.01.2006. |
This page has been discontinued, see General government, financial assets and liabilities, Quarterly.
Additional information
Contact
-
Jostein Birkelund
E-mail: jostein.birkelund@ssb.no
tel.: (+47) 40 90 26 55
-
Achraf Bougroug
E-mail: achraf.bougroug@ssb.no
tel.: (+47) 40 90 26 15
-
Frode Borgås
E-mail: frode.borgas@ssb.no
tel.: (+47) 40 90 26 52

