Content
Published:
This is an archived release.
Increased net financial assets
General government net financial assets amounted to NOK 1 943 billion at the end of 2005, an increase of NOK 434 billion from 2004. Total financial assets increased by 18.6 per cent and total liabilities increased by 5.0 per cent.
The growth in general government net financial assets is primarily caused by increased financial assets in central government. This is a result of large allocations to the Government Pension Fund- Global and high yields during the year. The growth is observed through the increase in net financial assets in "Other central government accounts", which was over NOK 383 billion in 2005.
In addition, net financial assets in the central government fiscal accounts including the National Insurance Scheme increased from NOK 210 billion in 2004 to NOK 226 billion in 2005.
Local governments total liabilities amounted to NOK 258 billion at the end of 2005. Total financial assets amounted to NOK 197 billion. Net financial debt increased by NOK 3.4 billion, and amounted to NOK 61 billion in 2005. Net borrowing according to the revenue and expenditure account was NOK 3.1 billion.
|
General government. Financial balance sheet.
Nominal value. NOK billion and change in per cent |
| NOK billion |
Change in
per cent |
||||||||||||||||||||||||||||||||||||||
|---|---|---|---|---|---|---|---|---|---|---|---|---|---|---|---|---|---|---|---|---|---|---|---|---|---|---|---|---|---|---|---|---|---|---|---|---|---|---|---|
| 2004 | 2005 | ||||||||||||||||||||||||||||||||||||||
| A.Financial assets total | 2 637.5 | 3 128.6 | 18.6 | ||||||||||||||||||||||||||||||||||||
| Cash and deposits | 181.7 | 210.0 | 15.6 | ||||||||||||||||||||||||||||||||||||
| Commercial papers and bonds | 687.8 | 739.3 | 7.5 | ||||||||||||||||||||||||||||||||||||
| Other loans | 831.8 | 1 030.1 | 23.8 | ||||||||||||||||||||||||||||||||||||
| Capital deposits and shares | 668.7 | 844.7 | 26.3 | ||||||||||||||||||||||||||||||||||||
| Other financial assets | 267.4 | 304.2 | 13.8 | ||||||||||||||||||||||||||||||||||||
| B. Liabilities total | 1 129.0 | 1 185.6 | 5.0 | ||||||||||||||||||||||||||||||||||||
| Commercial papers and Treasury bills | 71.1 | 59.1 | -16.9 | ||||||||||||||||||||||||||||||||||||
| Bonds | 163.9 | 179.0 | 9.2 | ||||||||||||||||||||||||||||||||||||
| Other loans | 763.3 | 832.4 | 9.1 | ||||||||||||||||||||||||||||||||||||
| Other liabilities | 130.4 | 114.8 | -12.0 | ||||||||||||||||||||||||||||||||||||
| C. Net financial assets(A-B) | 1 508.5 | 1 943.0 | - | ||||||||||||||||||||||||||||||||||||
| General gross debt | 795.6 | 850.2 | 6.9 | ||||||||||||||||||||||||||||||||||||
| Per cent of GDP | 46.3 | 44.7 | - | ||||||||||||||||||||||||||||||||||||
Gross public debt
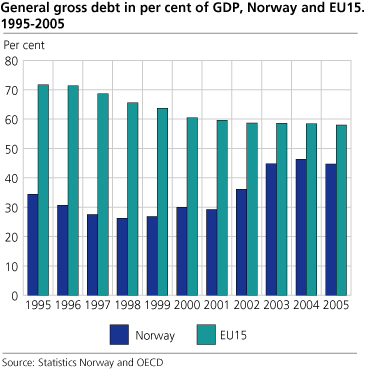
In spite of significant surplus in the general government, gross public debt as per cent of gross domestic product (GDP) has increased over the past years. This is due to the repurchase agreements of the Government Pension Fund- Global. Such agreements imply that both assets and liabilities increase. The Maastricht Treaty definition is usually used in international comparisons of gross public debt. The definition does not include internal accounts payable and liabilities in general government. According to this delimitation, Norway's public debt was 44.7 per cent of GDP at the end of 2005. Average for the EU-151 at the end of 2005 was 58.0 per cent, according to figures from the OECD.
1The European Union excluding the 10 new member states from 2004.
This page has been discontinued, see General government, financial assets and liabilities, Quarterly.
Additional information
Contact
-
Jostein Birkelund
E-mail: jostein.birkelund@ssb.no
tel.: (+47) 40 90 26 55
-
Achraf Bougroug
E-mail: achraf.bougroug@ssb.no
tel.: (+47) 40 90 26 15
-
Frode Borgås
E-mail: frode.borgas@ssb.no
tel.: (+47) 40 90 26 52

