Content
Published:
This is an archived release.
Decline in publicly owned enterprises
There were approximately 3 100 publicly owned non-financial enterprises at the end of 2009. About 2 500, i.e. 79 per cent, were local government owned enterprises, while the rest were owned by the central government. The most common type of business organisation was limited companies.
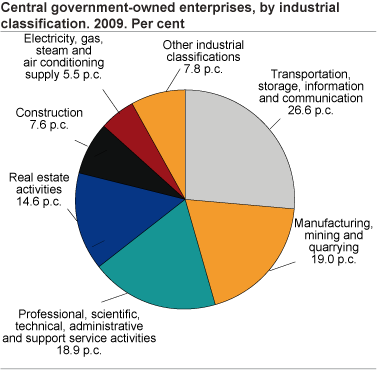
During 2009, the 657 central government owned enterprises were organised in the following major industrial classification areas. These are information and communication (18.3 per cent), real estate activities (14.6 per cent), professional, scientific and technical activities (14.6 per cent), mining and quarrying (14 per cent).
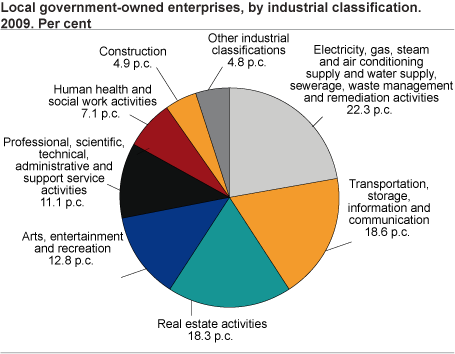
The major industrial classification areas for the local government owned enterprises were real estate activities (18.3 per cent), electricity, gas, steam and air conditioning supply (15.1 per cent), human health and social work activities (12.8 per cent) and transportation and storage (9.9 per cent).
The number of publicly owned enterprises increased significantly during the period from 2004 to 2009. One explanation for the recent development is the fact that some of the major enterprises have been reorganised either as a result of takeovers or buying and selling. The significant increase in the number of the enterprises from the period 2004 to 2005 is, however, also a result of the improved method of data collection in Statistics Norway. Nevertheless, the number of enterprises fell from 2008 to 2009. However, there have been more than 3 000 during the past four years. The reduction in the number of enterprises is mainly the result of mergers or closures.
Major business organisation forms
The central government owned enterprises were mostly organised as limited companies or public limited companies. About 626 enterprises or 95.3 per cent had this type of business organisation form by the end of 2009. A total of 1 955 or 78.7 per cent local government owned enterprises were organised as limited companies at the end of 2009.
Geographical concentration
Nordland county had the highest number of local government owned enterprises; about 243 enterprises or 9.7 per cent of the total number. Then followed Møre og Romsdal and Hordaland with 221 and 179 respectively. One explanation can be that these three counties have the largest number of municipalities. A local government owned enterprise normally has its registered address in the municipalities that have ownership.
In 2009, most of the central government owned enterprises were located in the four major counties; Oslo, Rogaland, Akershus, and Sør-Trøndelag, with 175, 112, 99, and 64 enterprises respectively. Generally, about 68.5 per cent of the central government owned enterprises were geographically located in these four counties. About 41.7 per cent of the enterprises were registered in Oslo and Akershus.
The basis of the computationThe statistics comprise public owned non-financial enterprises. An enterprise is defined as publicly owned if the majority shareholder in the enterprise directly or indirectly belongs to the central government or the local government. A local government enterprise can be owned by a municipality or by a county municipality.
The statistics also cover municipal and county municipal companies, inter-municipal companies and companies incorporated by the local government Act. One or more local governments wholly own these business entities. Inter municipal companies belong in the municipality where the head office is located. |
The new industrial classificationStatistics Norway has begun applying the new industrial classification (SN2007) in its statistical production. General information can be found here .
The structural business statistics for public non-financial enterprises are published with the standard for industrial classification (SIC 2007) with effect from 2007. The former standard for industrial classification (SIC 2002) is produced up to 2008 in the statistics bank. |
Tables:
- Table 1 Public non-financial corporation. Number. 2004-2009
- Table 2 Central government-owned enterprises, by industrial classification. Number and per cent. 2007-2009
- Table 3 Local government-owned enterprises, by industrial classification. Number and per cent. 2007-2009
- Table 4 Central government-owned enterprises, by organizational structure. Number and per cent. 2004-2009
- Table 5 Local government-owned enterprises, by organizational structure. Number and per cent. 2004-2009
- Table 6 Central government-owned enterprises, by county. Number and per cent. 2004-2009
- Table 7 Local government-owned enterprises, by county. Number and per cent. 2004-2009
Contact
-
Statistics Norway's Information Centre
E-mail: informasjon@ssb.no
tel.: (+47) 21 09 46 42


