Crude oil and natural gas prices up
Published:
The Producer Price Index (PPI) increased 3.1 per cent from December to January, which continued the overall growth that started in July 2017. The rise from December to January was led by higher prices on crude oil and natural gas.
- Full set of figures
- Producer price index
- Series archive
- Producer price index (archive)
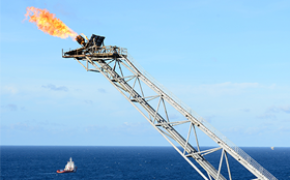
Prices on crude oil and natural gas combined rose by 6.6 per cent from December to January, which continued the price growth on Norway’s most important exported products. Crude oil and natural gas prices have both been rising since mid-2017.
Prices on mining support services, which includes services related to extraction, grew by 9.2 per cent. However, prices on these types of services tend to fluctuate from one month to the next. Price changes are often set as new contracts are concluded, amongst other factors.
Figure 1. Price indices. 2014=100
| Extraction of oil and natural gas | PPI total | |
| Jan. 2014 | 112.2 | 104.9 |
| Feb. 2014 | 110.9 | 104.2 |
| Mar. 2014 | 104.6 | 101.2 |
| Apr. 2014 | 103.7 | 100.7 |
| May 2014 | 101.5 | 99.8 |
| Jun. 2014 | 102.4 | 100.2 |
| Jul. 2014 | 98.5 | 99.7 |
| Aug. 2014 | 95.5 | 99 |
| Sept. 2014 | 95.8 | 99 |
| Oct. 2014 | 96.1 | 98.8 |
| Nov.2014 | 89.2 | 96.1 |
| Dec. 2014 | 89.8 | 96.3 |
| Jan. 2015 | 81 | 91.9 |
| Feb. 2015 | 85.5 | 93.9 |
| Mar. 2015 | 88.1 | 95.1 |
| Apr. 2015 | 88 | 95.1 |
| May 2015 | 88.8 | 95.1 |
| Jun. 2015 | 90.6 | 95.3 |
| Jul. 2015 | 86.1 | 93.1 |
| Aug. 2015 | 76.9 | 89.1 |
| Sept. 2015 | 77.1 | 89 |
| Oct. 2015 | 76.8 | 89.5 |
| Nov.2015 | 76.2 | 89.9 |
| Dec. 2015 | 68.4 | 85.9 |
| Jan. 2016 | 58 | 82 |
| Feb. 2016 | 56.3 | 79.9 |
| Mars.2016 | 57.9 | 80.9 |
| Apr. 2016 | 58.5 | 81.5 |
| May 2016 | 62.2 | 83.7 |
| Jun. 2016 | 65.9 | 86.1 |
| Jul. 2016 | 66.2 | 86.4 |
| Aug. 2016 | 64.1 | 84.9 |
| Sept. 2016 | 61.9 | 83.6 |
| Oct. 2016 | 64.5 | 85.4 |
| Nov.2016 | 67.2 | 87.6 |
| Dec. 2016 | 78.8 | 92.1 |
| Jan. 2017 | 77.5 | 92.4 |
| Feb. 2017 | 81.4 | 94.9 |
| Mar. 2017 | 80.4 | 93.9 |
| Apr. 2017 | 74.4 | 91.9 |
| May 2017 | 72.6 | 91.2 |
| Jun. 2017 | 68.7 | 88.9 |
| Jul. 2017 | 66.3 | 88 |
| Aug. 2017 | 66.7 | 88.3 |
| Sept. 2017 | 71.3 | 90.9 |
| Oct. 2017 | 78 | 93.1 |
| Nov.2017 | 83.2 | 96.1 |
| Dec. 2017 | 89.3 | 98.9 |
| Jan. 2018 | 95.1 | 101.9 |
Continued growth in manufacturing prices
Prices in manufacturing industries are characterised by steady growth since August 2017. This trend continued from December to January with an overall growth in manufacturing prices of 0.9 per cent. The increase from December to January was caused by higher prices in several industries. However, food products together with chemicals and pharmaceutical products were a major contributor to the overall growth in manufacturing prices. In addition, prices on repair and maintenance of machinery grew by 1.6 per cent. Price changes in this industry mainly take place at the turn of the year.
In the period August 2017-December 2017, the increasing manufacturing prices were largely driven by rising prices on refined petroleum products and basic metals. The rising prices on basic metals together with a decreasing exchange rate against several important currencies have contributed to higher prices on exported goods in this period.
Figure 2. Price indices. 2014=100
| Manufacturing total | Refined petroleum products | Basic metals | |
| Jan. 2014 | 99.9 | 104.7 | 91.9 |
| Feb. 2014 | 99.9 | 104.9 | 92.7 |
| Mar. 2014 | 99.4 | 102.6 | 92.5 |
| Apr. 2014 | 99.5 | 101.9 | 94.8 |
| May 2014 | 99.5 | 101.6 | 95.6 |
| Jun. 2014 | 100.1 | 103.5 | 98.8 |
| Jul. 2014 | 100.7 | 104.7 | 101.8 |
| Aug. 2014 | 101.2 | 104.1 | 102.4 |
| Sept. 2014 | 100.6 | 98.7 | 104.9 |
| Oct. 2014 | 100.3 | 97.5 | 105.1 |
| Nov.2014 | 100 | 92.7 | 107.7 |
| Dec. 2014 | 99 | 83.4 | 111.8 |
| Jan. 2015 | 97.5 | 71.6 | 115.6 |
| Feb. 2015 | 98.4 | 74 | 114.6 |
| Mar. 2015 | 99.1 | 79.8 | 117.3 |
| Apr. 2015 | 99.4 | 82.3 | 114 |
| May 2015 | 99.5 | 82.8 | 112.4 |
| Jun. 2015 | 99.7 | 83.2 | 112 |
| Jul. 2015 | 99.8 | 82.4 | 109.6 |
| Aug. 2015 | 98.6 | 76.8 | 106.5 |
| Sept. 2015 | 97.4 | 71.6 | 105.8 |
| Oct. 2015 | 97.8 | 73.6 | 105.3 |
| Nov.2015 | 98.4 | 72.8 | 104.6 |
| Dec. 2015 | 97.4 | 68.1 | 102.4 |
| Jan. 2016 | 96.1 | 61.3 | 101.1 |
| Feb. 2016 | 95.4 | 57.4 | 99.8 |
| Mars.2016 | 95.7 | 58.8 | 99.5 |
| Apr. 2016 | 96.4 | 62.7 | 98.1 |
| May 2016 | 97.8 | 68.6 | 98.7 |
| Jun. 2016 | 99 | 73.6 | 98.7 |
| Jul. 2016 | 100.3 | 76.5 | 102.7 |
| Aug. 2016 | 99.1 | 70.7 | 106.2 |
| Sept. 2016 | 98.6 | 70.8 | 104.6 |
| Oct. 2016 | 99.1 | 73.4 | 103 |
| Nov.2016 | 99.9 | 76.1 | 105.6 |
| Dec. 2016 | 100.6 | 77.7 | 108.6 |
| Jan. 2017 | 102.6 | 87.6 | 110.9 |
| Feb. 2017 | 104.6 | 94.1 | 115.9 |
| Mar. 2017 | 104 | 87.3 | 118.5 |
| Apr. 2017 | 104.3 | 86.2 | 121.5 |
| May 2017 | 104.2 | 82 | 122.3 |
| Jun. 2017 | 103.5 | 77.8 | 121 |
| Jul. 2017 | 103 | 74.6 | 121 |
| Aug. 2017 | 102.9 | 77.2 | 121.3 |
| Sept. 2017 | 104.2 | 85.5 | 123.2 |
| Oct. 2017 | 104.7 | 90.9 | 121.3 |
| Nov.2017 | 105.9 | 92.2 | 128.3 |
| Dec. 2017 | 107.6 | 101.3 | 129.8 |
| Jan. 2018 | 108.5 | 101.8 | 130.4 |
Contact
-
Marius Andersen
-
Statistics Norway's Information Centre


