Content
Published:
This is an archived release.
Lower price growth in management consulting
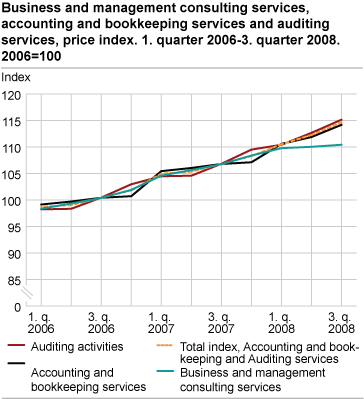
Within 2008 the price growth has been gradual declining for business and management consulting services. The 3rd quarter of 2008 shows an increase of 3.4 per cent compared with the same period last year.
Within this year’s first two quarters the prices for business and management consulting services increased with 4.9 and 4.1 per cent respectively compared with corresponding quarters in 2007. In the 3r d quarter of 2008 the price growth was 3.4 per cent.
Prices for accounting services up 7 per cent
From the 3r d quarter of 2007 to the 3r d quarter of 2008 the prices for accounting services and auditing activities rose by 7.3 per cent. The price increase was a little higher for auditing activities than for accounting services.
| Period | Prices | ||||||||||||||||||||||||||||||||||||||
|---|---|---|---|---|---|---|---|---|---|---|---|---|---|---|---|---|---|---|---|---|---|---|---|---|---|---|---|---|---|---|---|---|---|---|---|---|---|---|---|
| Business and management consultancy services | Change from same quarter in the previous year, per cent | Total index, accounting, bookkeeping and auditing | Change from same quarter in the previous year, per cent | Accounting and bookkeeping services | Change from same quarter in the previous year, per cent | Auditing activties | Change from same quarter in the previous year, per cent | ||||||||||||||||||||||||||||||||
| 2006 | |||||||||||||||||||||||||||||||||||||||
| 1. quarter1 | 98.4 | 98.7 | 99.1 | 98.2 | |||||||||||||||||||||||||||||||||||
| 2. quarter1 | 99.3 | 99.0 | 99.7 | 98.3 | |||||||||||||||||||||||||||||||||||
| 3. quarter1 | 100.4 | 100.4 | 100.4 | 100.5 | |||||||||||||||||||||||||||||||||||
| 4. quarter1 | 101.9 | 101.8 | 100.7 | 103.0 | |||||||||||||||||||||||||||||||||||
| 2007 | |||||||||||||||||||||||||||||||||||||||
| 1. quarter | 104.6 | 105.0 | 105.4 | 104.5 | |||||||||||||||||||||||||||||||||||
| 2. quarter | 105.6 | 105.3 | 106.0 | 104.6 | |||||||||||||||||||||||||||||||||||
| 3. quarter | 106.7 | 106.8 | 106.8 | 106.8 | |||||||||||||||||||||||||||||||||||
| 4. quarter | 108.4 | 108.3 | 107.1 | 109.5 | |||||||||||||||||||||||||||||||||||
| 2008 | |||||||||||||||||||||||||||||||||||||||
| 1. quarter | 109.8 | 4.9 | 110.5 | 5.3 | 110.6 | 4.9 | 110.4 | 5.7 | |||||||||||||||||||||||||||||||
| 2. quarter | 110.0 | 4.1 | 112.3 | 6.6 | 111.9 | 5.5 | 112.7 | 7.7 | |||||||||||||||||||||||||||||||
| 3. quarter | 110.4 | 3.4 | 114.7 | 7.3 | 114.2 | 6.9 | 115.2 | 7.8 | |||||||||||||||||||||||||||||||
| 1 | The figures for 2006 are based on estimation from the annual growth in monthly earnings in the industrial classification of legal, accounting, book-keeping and auditing activities. |
The statistics is published with Producer price indices for services.
Contact
-
Statistics Norway's Information Centre
E-mail: informasjon@ssb.no
tel.: (+47) 21 09 46 42

