Content
Published:
This is an archived release.
Rise in prices for civil engineering activities
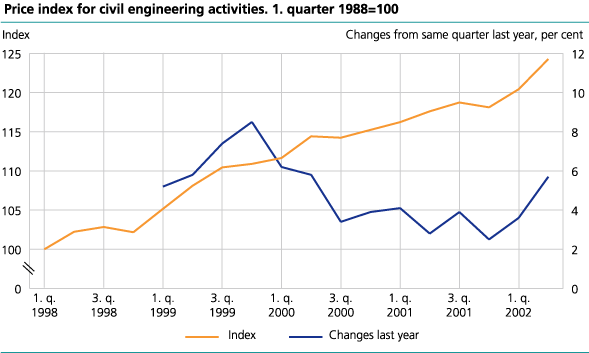
Statistic Norway's last figures show a rise in prices of civil engineering activities. The increase from the 2nd quarter 2001 to the 2nd quarter 2002 was 5.7 per cent.
The increase from the 1s t quarter to the 2n d quarter 2002 was 3.2 per cent. This represents most of the yearly increase.
|
Price index for civil engineering
activities. 1st quarter 1998-2nd quarter 2002. 1st quarter 1998=100 |
| Period | Prices | ||||||||||||||||||||||||||||||||||||||
|---|---|---|---|---|---|---|---|---|---|---|---|---|---|---|---|---|---|---|---|---|---|---|---|---|---|---|---|---|---|---|---|---|---|---|---|---|---|---|---|
| Index | Changes last year, per cent | ||||||||||||||||||||||||||||||||||||||
| 1998 | 101.8 | ||||||||||||||||||||||||||||||||||||||
| 1999 | 108.7 | 6.7 | |||||||||||||||||||||||||||||||||||||
| 2000 | 113.9 | 4.8 | |||||||||||||||||||||||||||||||||||||
| 2001 | 117.7 | 3.3 | |||||||||||||||||||||||||||||||||||||
| 1998 | |||||||||||||||||||||||||||||||||||||||
| 1. quarter | 100.0 | ||||||||||||||||||||||||||||||||||||||
| 2. quarter | 102.2 | ||||||||||||||||||||||||||||||||||||||
| 3. quarter | 102.8 | ||||||||||||||||||||||||||||||||||||||
| 4. quarter | 102.2 | ||||||||||||||||||||||||||||||||||||||
| 1999 | |||||||||||||||||||||||||||||||||||||||
| 1. quarter | 105.2 | 5.2 | |||||||||||||||||||||||||||||||||||||
| 2. quarter | 108.1 | 5.8 | |||||||||||||||||||||||||||||||||||||
| 3. quarter | 110.5 | 7.4 | |||||||||||||||||||||||||||||||||||||
| 4. quarter | 110.9 | 8.5 | |||||||||||||||||||||||||||||||||||||
| 2000 | |||||||||||||||||||||||||||||||||||||||
| 1. quarter | 111.7 | 6.2 | |||||||||||||||||||||||||||||||||||||
| 2. quarter | 114.4 | 5.8 | |||||||||||||||||||||||||||||||||||||
| 3. quarter | 114.2 | 3.4 | |||||||||||||||||||||||||||||||||||||
| 4. quarter | 115.2 | 3.9 | |||||||||||||||||||||||||||||||||||||
| 2001 | |||||||||||||||||||||||||||||||||||||||
| 1. quarter | 116.2 | 4.1 | |||||||||||||||||||||||||||||||||||||
| 2. quarter | 117.6 | 2.8 | |||||||||||||||||||||||||||||||||||||
| 3. quarter | 118.7 | 3.9 | |||||||||||||||||||||||||||||||||||||
| 4. quarter | 118.1 | 2.5 | |||||||||||||||||||||||||||||||||||||
| 2002 | |||||||||||||||||||||||||||||||||||||||
| 1. quarter | 120.4 | 3.6 | |||||||||||||||||||||||||||||||||||||
| 2. quarter | 124.3 | 5.7 | |||||||||||||||||||||||||||||||||||||
The statistics is published with Producer price indices for services.
Contact
-
Statistics Norway's Information Centre
E-mail: informasjon@ssb.no
tel.: (+47) 21 09 46 42

