Content
Published:
This is an archived release.
Steady increase in consultancy prices
Prices of computer consultancy services increased by 0.8 per cent during the 3rd quarter this year. The year-on-year increase is 3.7 per cent.
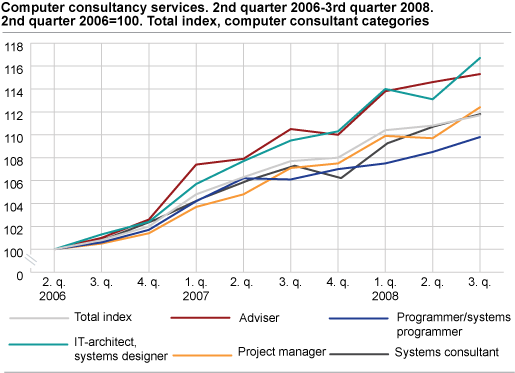
Prices of computer consultancy services increased by 3.7 per cent from the 3rd quarter of 2007 to the 3rd quarter of 2008. From the 2nd quarter to the 3rd quarter of 2008, the increase was 0.8 per cent. In comparison, prices increased by 0.4 per cent on a quarterly basis the previous quarter.
The sub-index for IT-architects had the largest increase from the previous quarter with 3.2 per cent. The same group has had the largest increase over the past year with 6.6 per cent.
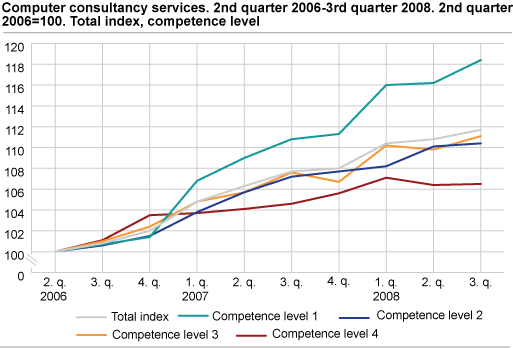
Considering the price changes for different levels of competence, the strongest increase was seen for those with the lowest level of competence. From the 3rd quarter of 2007 to the 3rd quarter of 2008, the increase was 6.9 per cent for this group. In comparison, the prices charged by computer consultants with the highest competence level only increased by 1.8 per cent. Even on a quarter-on-quarter basis the group with the lowest level of competence has had the strongest increase in prices with 1.9 per cent compared to only 0.1 per cent increase for those with the highest level of competence.
| Indeks |
Changes from
3rd quarter 2007, per cent |
Changes from
2nd quarter 2008, per cent |
|||||||||||||||||||||||||||||||||||||
|---|---|---|---|---|---|---|---|---|---|---|---|---|---|---|---|---|---|---|---|---|---|---|---|---|---|---|---|---|---|---|---|---|---|---|---|---|---|---|---|
| 3rd quarter 2007 | 4th quarter 2007 | 1st quarter 2008 | 2nd quarter 2008 | 3rd quarter 2008 | |||||||||||||||||||||||||||||||||||
| Total index | 107.7 | 108.0 | 110.4 | 110.8 | 111.7 | 3.7 | 0.8 | ||||||||||||||||||||||||||||||||
| IT-architect, systems designer | 109.5 | 110.3 | 114.0 | 113.1 | 116.7 | 6.6 | 3.2 | ||||||||||||||||||||||||||||||||
| Programmer/systems programmer | 106.1 | 107.0 | 107.5 | 108.5 | 109.8 | 3.5 | 1.2 | ||||||||||||||||||||||||||||||||
| Project manager | 107.1 | 107.5 | 109.9 | 109.7 | 112.4 | 4.9 | 2.5 | ||||||||||||||||||||||||||||||||
| Adviser | 110.5 | 110.0 | 113.8 | 114.6 | 115.3 | 4.3 | 0.6 | ||||||||||||||||||||||||||||||||
| Systems consultant | 107.3 | 106.2 | 109.3 | 110.8 | 111.9 | 4.3 | 1.0 | ||||||||||||||||||||||||||||||||
| Competence level 1 | 110.8 | 111.3 | 116.0 | 116.2 | 118.4 | 6.9 | 1.9 | ||||||||||||||||||||||||||||||||
| Competence level 2 | 107.2 | 107.7 | 108.2 | 110.1 | 110.4 | 3.0 | 0.3 | ||||||||||||||||||||||||||||||||
| Competence level 3 | 107.6 | 106.7 | 110.2 | 109.8 | 111.1 | 3.3 | 1.2 | ||||||||||||||||||||||||||||||||
| Competence level 4 | 104.6 | 105.6 | 107.1 | 106.4 | 106.5 | 1.8 | 0.1 | ||||||||||||||||||||||||||||||||
|
The four competence levels are defined by education and work experience. Level 1: Education within the field and up to one year of experience. Level 2: Education within the field and between one and three years of experience. Level 3: At least three years of education and more than eight years of experience. Level 4: Expert competence and at least seven to twelve years of experience. For more information, see About the statistics . |
|
New standard industrial classification The statistics for the 1st quarter of 2009 will be published according to the new standard industrial classification (NACE rev.2). This statistics will be maintained as a price index for computer consultancy services (new activity code 62). The activity publishing of software will then no longer be a part of this index. |
The statistics is published with Producer price indices for services.
Contact
-
Statistics Norway's Information Centre
E-mail: informasjon@ssb.no
tel.: (+47) 21 09 46 42


