Content
Published:
This is an archived release.
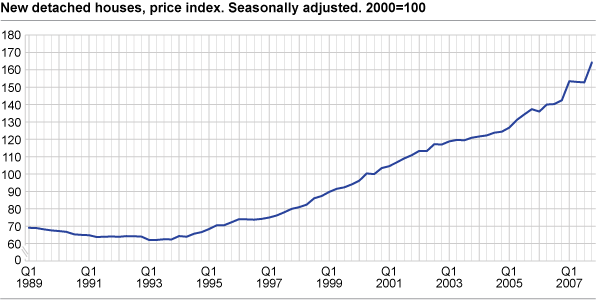
Strong price growth for new detached houses
Prices of new detached houses increased by 15.3 per cent from the fourth quarter of 2006 to the fourth quarter of 2007. This is the strongest annual growth since the index was introduced in 1989.
From the third quarter to the fourth quarter of 2007, the increase in prices was 7.5 per cent. Adjusted for seasonal variations, the increase was also 7.5 per cent.
Prices of new detached houses reached a record low in the first quarter of 1993. Since then, prices have increased by 166.2 per cent. In comparison, prices of second-hand detached houses have increased by 221.9 per cent in the same period. The construction cost index for wooden detached houses shows a growth of 68.4 per cent in the same period.
Annual growth 11.6 per cent
From 2006 to 2007, the annual price index for new detached houses increased by 11.6 per cent. This is based on the average of the quarterly indexes.
A total of 470 observations were used in the calculation of the index in the fourth quarter.
| Index 4th quarter 2007 | Change in per cent | ||||||||||||||||||||||||||||||||||||||
|---|---|---|---|---|---|---|---|---|---|---|---|---|---|---|---|---|---|---|---|---|---|---|---|---|---|---|---|---|---|---|---|---|---|---|---|---|---|---|---|
|
3rd quarter 2007-
4th quarter 2007 |
4th quarter 2006-
4th quarter 2007 |
||||||||||||||||||||||||||||||||||||||
| Unadjusted index | 164.0 | 7.5 | 15.3 | ||||||||||||||||||||||||||||||||||||
| Seasonally adjusted index | 164.2 | 7.5 | - | ||||||||||||||||||||||||||||||||||||
Tables:
The statistics is now published as Price index for new dwellings.
Contact
-
Statistics Norway's Information Centre
E-mail: informasjon@ssb.no
tel.: (+47) 21 09 46 42

