Content
Published:
This is an archived release.
Harmonized index down 0.3 per cent
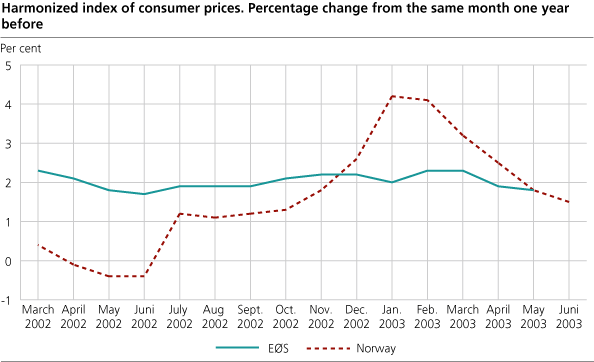
The harmonized index of consumer prices (HICP) for Norway was 115.5 (1996=100) in June, down 0.3 per cent from May. HICP for Norway rose 1.5 per cent from June 2002 to June 2003. The year-to-year growth in the EEA was 1.8 per cent in May.
HICP for Norway fell by 0.3 per cent from May to June mainly due to the price developments of electricity, clothing and services connected to recreation and housing. The year-to-year change was 1.5 per cent in June, down from 1.8 per cent in May. See The consumer price index for more details.
Year-to-year change in the EEA
From May 2002 to May 2003 the consumer prices in the EEA went up 1.8 per cent. Ireland had the highest growth of 3.9 per cent followed by Portugal with a price growth of 3.7 per cent. The lowest consumer price growth in May was registered in Germany with 0.6 per cent.
During the last 12 months household payments for education had the largest growth rate in the EEA with 5.2 per cent from May 2002 to May 2003. Denmark and Iceland had the highest price growth, while Sweden had the lowest. Prices of alcoholic beverages and tobacco rose, in the same period by 4.8 per cent. Ireland and Iceland showed the highest growth.
The prices of communications declined slightly with 0.3 per cent the last 12 months. It is mainly telephone equipment prices that have declined. Greece and Luxembourg had the largest decrease among the countries in the EEA with a price reduction of 5.9 and 4.2 per cent respectively.
In advance, Eurostat estimated the year-to-year change in May in the Euro-zone to 1.9 per cent, which turned out to be the actual price growth. Expected growth in the consumer prices in the Euro-zone in June is 2.0 per cent. The HICP for the European Union increased by 1.8 per cent in May.
|
Harmonized Indices of Consumer Prices for Norway and
other selected countries. Change in per cent |
| April 2002 -April 2003 | May 2002-May 2003 | June 2002-June 2003 | |||||||||||||||||||||||||||||||||||||
|---|---|---|---|---|---|---|---|---|---|---|---|---|---|---|---|---|---|---|---|---|---|---|---|---|---|---|---|---|---|---|---|---|---|---|---|---|---|---|---|
| Norway | 2.5 | 1.8 | 1.5* | ||||||||||||||||||||||||||||||||||||
| Iceland | 1.9 | 1.8 | |||||||||||||||||||||||||||||||||||||
| Sweden | 2.3 | 2.0 | |||||||||||||||||||||||||||||||||||||
| Denmark | 2.5 | 2.1 | |||||||||||||||||||||||||||||||||||||
| Finland | 1.3 | 1.1 | |||||||||||||||||||||||||||||||||||||
| Germany | 1.0 | 0.6 | |||||||||||||||||||||||||||||||||||||
| UK | 1.5 | 1.2 | |||||||||||||||||||||||||||||||||||||
| EEA | 2.0 | 1.8* | |||||||||||||||||||||||||||||||||||||
| EU | 2.0 | 1.8* | |||||||||||||||||||||||||||||||||||||
| Euro-zone | 2.1 | 1.9* | |||||||||||||||||||||||||||||||||||||
| US1 | 2.2 | 2.1 | |||||||||||||||||||||||||||||||||||||
| Japan1 | -0.1 | ... | |||||||||||||||||||||||||||||||||||||
| 1 | National CPI. |
| Source: Source: Statistics Norway and EUROSTAT. | |
The statistics is now published as Consumer price index.
Contact
-
Konsumprisindeksen
E-mail: konsumprisindeksen@ssb.no
tel.: (+47) 62 88 56 34
-
Kjersti Nyborg Hov
E-mail: kjersti.nyborg.hov@ssb.no
tel.: (+47) 40 90 23 63
-
Camilla Rochlenge
E-mail: camilla.rochlenge@ssb.no
tel.: (+47) 40 90 23 72
-
Gunnar Larsson
E-mail: gunnar.larsson@ssb.no
tel.: (+47) 40 90 26 79
-
Trym Kristian Økland
E-mail: trym.okland@ssb.no
tel.: (+47) 46 81 09 15

