Content
Published:
This is an archived release.
Price growth for legal activities
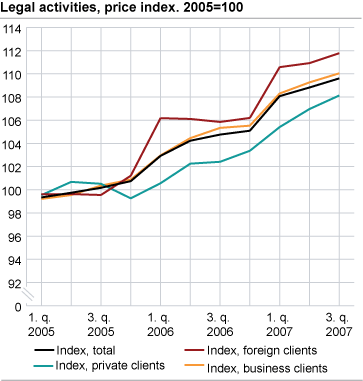
In the last two years, prices for legal activities have risen nearly 10 per cent. Foreign clients have been most affected by the price increase, but businesses and private households have also experienced higher prices.
Prices for legal activities were 9.6 per cent higher during third quarter of 2007 compared with the average price in 2005. That figure exceeds the consumer price index (CPI) by 6.6 percentage points in the same period.
For business clients, the prices increased by 10 per cent from the average of 2005 to the third quarter of 2007. Businesses account for about 66 per cent of the turnover and constitute the largest group of customers in the industry. The foreign clients experienced an 11.8 per cent price growth, while private households paid 8.1 per cent higher prices during the same period. Legal activities aimed at foreign and private clients made up 15.2 and 9.5 per cent of the market respectively.
4.6 per cent more expensive last year
From the third quarter of 2006 to the same quarter of 2007, we find that the total index has increased 4.6 per cent. For business clients the price rise was 4.5 per cent, while a 5.6 per cent growth was registered for both foreign and private clients.
| Period | Prices | Sub indices | |||||||||||||||||||||||||||||||||||||
|---|---|---|---|---|---|---|---|---|---|---|---|---|---|---|---|---|---|---|---|---|---|---|---|---|---|---|---|---|---|---|---|---|---|---|---|---|---|---|---|
| Total index |
Change from
same quarter in the previous year, per cent |
Foreign
clients |
Private
clients |
Business
clients |
|||||||||||||||||||||||||||||||||||
| 2005 | |||||||||||||||||||||||||||||||||||||||
| 1. quarter | 99.3 | 99.6 | 99.5 | 99.2 | |||||||||||||||||||||||||||||||||||
| 2. quarter | 99.7 | 99.6 | 100.7 | 99.5 | |||||||||||||||||||||||||||||||||||
| 3. quarter | 100.2 | 99.6 | 100.5 | 100.4 | |||||||||||||||||||||||||||||||||||
| 4. quarter | 100.7 | 101.2 | 99.3 | 100.9 | |||||||||||||||||||||||||||||||||||
| 2006 | |||||||||||||||||||||||||||||||||||||||
| 1. quarter | 102.9 | 3.6 | 106.2 | 100.6 | 103.0 | ||||||||||||||||||||||||||||||||||
| 2. quarter | 104.2 | 4.5 | 106.1 | 102.3 | 104.5 | ||||||||||||||||||||||||||||||||||
| 3. quarter | 104.8 | 4.6 | 105.9 | 102.4 | 105.3 | ||||||||||||||||||||||||||||||||||
| 4. quarter | 105.1 | 4.3 | 106.2 | 103.4 | 105.5 | ||||||||||||||||||||||||||||||||||
| 2007 | |||||||||||||||||||||||||||||||||||||||
| 1. quarter | 108.1 | 5.0 | 110.6 | 105.4 | 108.3 | ||||||||||||||||||||||||||||||||||
| 2. quarter | 108.8 | 4.4 | 110.9 | 107.0 | 109.3 | ||||||||||||||||||||||||||||||||||
| 3. quarter | 109.6 | 4.6 | 111.8 | 108.1 | 110.0 | ||||||||||||||||||||||||||||||||||
About the industryThe legal activities industry consisted of 2 340 establishments in 2005. These establishments employed 6 956 people and had a turnover of almost NOK 7.8 billion, according to Statistics Norway’s structural statistics. Data sourcesStatistics Norway receives data from about 90 establishments in the industry. AnalysisThe establishments are divided into three size strata. For each establishment we calculate price changes (ratios) from the price reference period to the statistical period. The individual price changes are aggregated and weighed according to the establishment’s size stratum, type of employee, type of client and type of case (civil or criminal law) in that order. All price changes are included in the total index. The weights being used are calculated from turnover in each of the categories mentioned above. Turnover data are collected annually during the Classification of Products by Activity survey. The price measuredThe price measured in this index is average charge-out rates per hour (the respondents are asked to report invoiced rates if available or alternatively to use list prices), excl. VAT. Time of measurementThe statistics consists of all transactions that have been carried through in the quarter in question. |
The statistics is published with Producer price indices for services.
Contact
-
Statistics Norway's Information Centre
E-mail: informasjon@ssb.no
tel.: (+47) 21 09 46 42

