Content
Published:
This is an archived release.
CPI rose 0.6 per cent from March to April
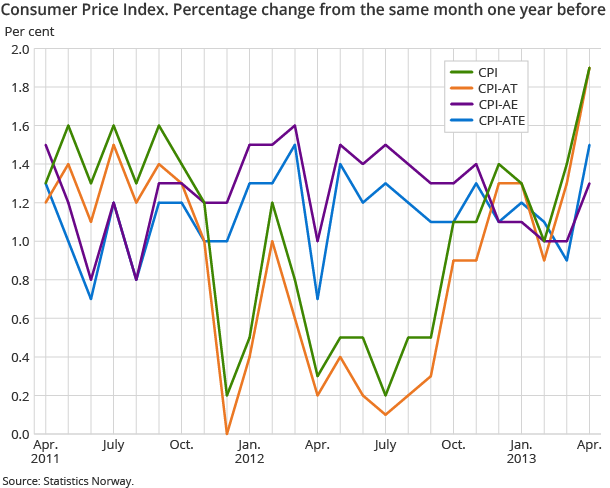
The Consumer Price Index (CPI) rose by 0.6 per cent from March to April, mainly due to higher food prices. The year-to-year growth in the CPI was 1.9 per cent in April, while the CPI-ATE increased 1.5 per cent in the same period.
| Monthly change (per cent) | 12-month rate (per cent) | Index | |
|---|---|---|---|
| March 2013 - April 2013 | April 2012 - April 2013 | April 2013 | |
| CPI All-item index | 0.6 | 1.9 | 134.2 |
| Food and non-alcoholic beverages | 1.1 | 0.6 | 123.7 |
| Housing, water, electricity, gas and other fuels | 0.4 | 5.2 | 166.5 |
| Transport | -0.7 | 0.5 | 144.8 |
| Recreation and culture | 1.6 | 0.2 | 116.9 |
| Clothing and footwear | 2.2 | -2.4 | 55.8 |
| CPI-ATE (july 1999 = 100) | 0.6 | 1.5 | 124.5 |
| CPI by delivery sector | |||
| Other consumer goods produced in Norway | 0.9 | 4.9 | 162.9 |
| Imported consumer goods | 1.1 | -0.1 | 90.7 |
| Other services with wages as dominating price factor | -0.1 | 3.3 | 200.7 |
The CPI was 134.2 (1998=100) in April 2013, compared to 131.7 in the same month the year before.
This represents a year-to-year growth of 1.9 per cent, up 0.5 percentage points from March. The year-to-year growth in the CPI adjusted for taxes and excluding energy (CPI-ATE) was 1.5 per cent in April, up 0.6 percentage points from the month before.
More details about the CPI, monthly and year-to-year changes, are given in the paragraph below.
Monthly change – higher prices on numerous consumer goods
From March to April, the CPI rose by 0.6 per cent. During this period, numerous goods showed higher prices, while services contributed less. The single most important contributor to the rise of the CPI was a 1.3 per cent rise in food prices. The groups with the largest price increase were fresh fruit and fresh vegetables, together with chocolate. This month’s price increase has to be viewed in conjunction with last month’s price decrease, caused mainly by Easter sales activity.
Another main contributor to the rise in the CPI was increased prices of clothing and footwear, where prices rose 2.2 per cent. Prices of books showed, as usual, a large increase in April, after several months of sales activity. The increase this year was 17.7 per cent. The group containing inter alia furniture had a price increase of 3.6 per cent this month, after an unusual price fall last month. Prices of electricity continued on an upwards path from March to April. Higher electricity prices can partly be explained by continued cold and dry weather.
The only service contributing to this month’s rise in the CPI was the 5.7 per cent increase in prices of package holidays. These prices are measured quarterly and a price increase is usual for this period.
The growth in the CPI was dampened by lower airfares and decreased prices of fuels.
Year-to-year growth – higher electricity prices contributed most
The CPI rose by 1.9 per cent from April 2012 to April 2013. The main contributor to the year-to-year growth was the 19.0 per cent increase in prices of electricity including grid rent, with most of the increase in electricity prices. The CPI excluding electricity (CPI-AEL) rose by 1.2 per cent in the same period, thus the electricity prices accounted for 0.7 percentage points of the year-to-year growth in the CPI.
Imputed rentals for homeowners rose by 2.3 per cent from April last year. Alcoholic beverages and tobacco have shown a joint price increase of 4.3 per cent over the last 12 months, and the prices of restaurant services have risen by 3.6 per cent. Food prices increased 0.9 per cent, and actual rentals rose 3.0 per cent. The prices of transport services and recreational and cultural services increased 3.7 and 2.5 per cent respectively.
Prices of fuels and lubricants fell 5.8 per cent from April 2012 to April 2013, thus dampening the year-to-year growth in the CPI. Clothing showed a price decrease of 3.0 per cent in the same period.
Change in the year-to-year growth – increased price growth
The year-to-year growth in the CPI rose by 0.5 percentage points, from 1.4 per cent in March 2013 to 1.9 per cent in April 2013. The price development of food was the main cause of the increase in the year-to-year growth. From March to April 2013, prices rose significantly, while falling in the same period the year before. This has to be viewed in conjunction with the typical Easter sales being recorded in March this year, as opposed to April last year. Prices of electricity including grid rent also rose from March to April this year, while decreasing in the same period the year before.
Prices of fuels and lubricants fell from March to April this year, while increasing in the same period the year before, thus pulling the year-to-year growth in the opposite direction.
The year-to year growth in the CPI adjusted for tax changes and excluding energy products (CPI-ATE) was 1.5 per cent in April, up 0.6 percentage points from March. The increased price growth of the CPI-ATE was mainly caused by the price development of food, furniture etc., and clothing and footwear.
Contact
-
Statistics Norway's Information Centre
E-mail: informasjon@ssb.no
tel.: (+47) 21 09 46 42
-
Konsumprisindeksen
E-mail: konsumprisindeksen@ssb.no
tel.: (+47) 62 88 56 34
-
Camilla Rochlenge
E-mail: camilla.rochlenge@ssb.no
tel.: (+47) 40 90 23 72
-
Kjersti Nyborg Hov
E-mail: kjersti.nyborg.hov@ssb.no
tel.: (+47) 40 90 23 63
-
Gunnar Larsson
E-mail: gunnar.larsson@ssb.no
tel.: (+47) 40 90 26 79
-
Trym Kristian Økland
E-mail: trym.okland@ssb.no
tel.: (+47) 46 81 09 15

