Content
Published:
This is an archived release.
No change in the CPI
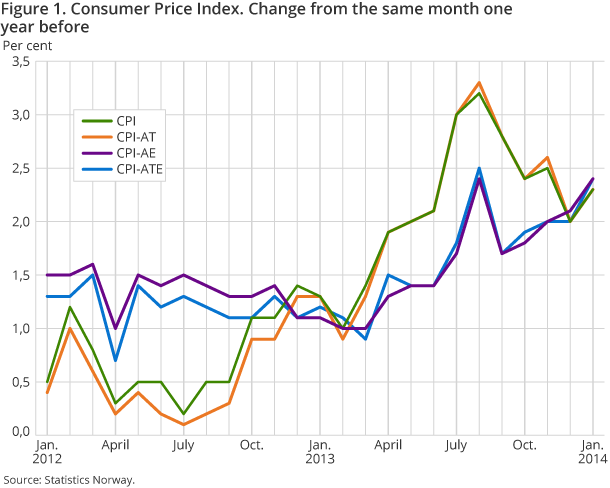
The Consumer Price Index (CPI) showed no change from December 2013 to January 2014. The year-to-year growth in the CPI was 2.3 per cent in January, while the CPI-ATE was 2.4 in the same period.
| Monthly change (per cent) | 12-month rate (per cent) | Index | |
|---|---|---|---|
| December 2013 - January 2014 | January 2013 - January 2014 | January 2014 | |
| CPI All-item index | 0.0 | 2.3 | 135.1 |
| Food and non-alcoholic beverages | 1.0 | 3.1 | 126.0 |
| Housing, water, electricity, gas and other fuels | 0.7 | 2.5 | 168.3 |
| Transport | 0.1 | 1.5 | 145.9 |
| Recreation and culture | -0.5 | 1.3 | 118.0 |
| Clothing and footwear | -4.9 | 1.4 | 52.5 |
| CPI-ATE (july 1999 = 100) | -0.1 | 2.4 | 125.6 |
| CPI by delivery sector | |||
| Other consumer goods produced in Norway | 1.1 | 3.0 | 163.2 |
| Imported consumer goods | -0.9 | 1.5 | 89.9 |
| Other services with wages as dominating price factor | 0.7 | 3.1 | 206.2 |

The CPI was 135.1 (1998=100) in January 2014, compared to 132.1 in January 2013, which corresponds to a year-to-year growth of 2.3 per cent.
Monthly change: no change
From December 2013 to January 2014, the CPI remained unchanged. Among the consumer groups that pulled the CPI up, food and non-alcoholic beverages were the main contributors with a combined price increase of 1.0 per cent. The prices of purchase of vehicles showed an increase of 1.8 per cent during this period, which can partly be explained by tax changes for cars as of 1 January 2014. From December 2013 to January 2014, both actual and imputed rentals of owner-occupiers rose by 0.6 per cent. The prices of maintenance and repair of personal transport equipment and recreational and cultural services showed price increases of 1.1 and 1.9 per cent respectively. In the same period, the prices of financial services n.e.c. increased by 1.6 per cent. Other consumption groups that pulled the CPI up were alcoholic beverages and tobacco, together with social protection services.
Prices of clothing and footwear showed a combined price fall of 4.9 per cent from December 2013 to January 2014, thus pulling the CPI in the opposite direction. The lower prices on clothing and footwear were mainly caused by seasonal sales activity. Airfares showed a price fall of 18.0 per cent in the same period. Prices of furniture and furnishings decreased by 5.2 per cent, mainly due to sales activity. From December 2013 to January 2014, prices of package holidays and books decreased by 6.0 and 10.9 per cent respectively. The prices of package holidays are measured quarterly.
Year-to-year growth: CPI up 2.3 per cent
The CPI rose by 2.3 per cent from January 2013 to January 2014. The main contributors to the year-to-year growth were imputed rentals for owner-occupiers and the prices of food and non-alcoholic beverages. Imputed rentals for owner-occupiers increased by 3.7 per cent, while food and non-alcoholic beverages showed a combined price increase of 3.1 per cent during this period. Prices of furniture and furnishings and prices of maintenance and repair of personal transport equipment rose by 12.5 and 3.8 per cent respectively. From January 2013 to January 2014, the prices of alcoholic beverages and tobacco rose 4.5 per cent combined, and restaurant services showed a price increase of 3.2 per cent.
The kindergarten fees showed an increase of 3.0 per cent since the last measurement in January 2013.
The rise in the CPI was mainly curbed by lower airfares, which fell by 17.7 per cent from January 2013 to January 2014. Prices of electricity including grid rent showed an overall price fall of 1.4 per cent, in spite of an increase in grid rent. Telephone services also showed a price fall during this period.
Change in the year-to-year growth: increased growth
The year-to-year growth in the CPI increased from 2.0 per cent in December 2013 to 2.3 per cent in January 2014. The main contributor to the increase in the year-to-year growth was the price development of clothing. Prices of clothing fell 5.3 per cent from December 2013 to January 2014, while falling 8.7 per cent from December 2012 to January 2013. The price development of furniture and furnishings together with the price development of purchases of vehicles also had a positive impact on the rise in the year-to-year growth. On the other hand, the price development of transport services pulled the growth in the CPI in the opposite direction.
The year-to year growth in the CPI-ATE was 2.4 per cent in January 2014.
New weights and items in the CPI Open and readClose
The weights in the CPI are updated in January each year based on the national account measures on household consumption. The sample of goods and services in the CPI are also updated in January each year. See The weights in the CPI (Table 2) .
Contact
-
Statistics Norway's Information Centre
E-mail: informasjon@ssb.no
tel.: (+47) 21 09 46 42
-
Konsumprisindeksen
E-mail: konsumprisindeksen@ssb.no
tel.: (+47) 62 88 56 34
-
Camilla Rochlenge
E-mail: camilla.rochlenge@ssb.no
tel.: (+47) 40 90 23 72
-
Kjersti Nyborg Hov
E-mail: kjersti.nyborg.hov@ssb.no
tel.: (+47) 40 90 23 63
-
Gunnar Larsson
E-mail: gunnar.larsson@ssb.no
tel.: (+47) 40 90 26 79
-
Trym Kristian Økland
E-mail: trym.okland@ssb.no
tel.: (+47) 46 81 09 15
