Content
Published:
This is an archived release.
Small decrease in CPI
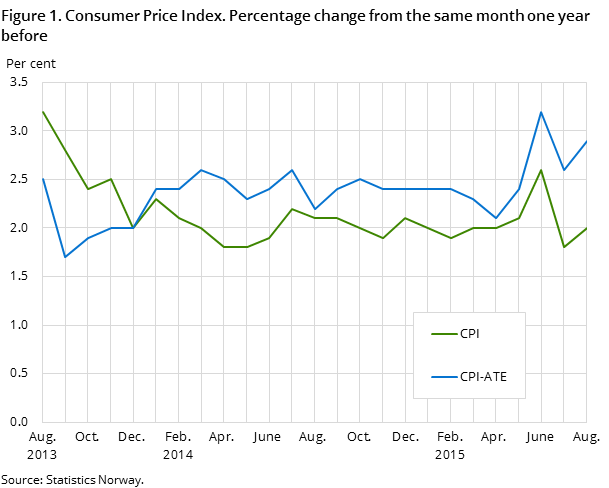
The Consumer Price Index (CPI) fell 0.1 per cent from July to August 2015, mostly due to lower prices on fuels, food and airline tickets. Increased electricity prices dampened the CPI decrease. The year-to-year growth in the CPI was 2.0 per cent in August, up 0.2 percentage points from July.
| Monthly change (per cent) | 12-month rate (per cent) | Index | |
|---|---|---|---|
| July 2015 - August 2015 | August 2014 - August 2015 | August 2015 | |
| CPI All-item index | -0.1 | 2.0 | 139.7 |
| Food and non-alcoholic beverages | -0.8 | 3.3 | 135.0 |
| Housing, water, electricity, gas and other fuels | 0.5 | -0.2 | 168.1 |
| Transport | -1.2 | 0.9 | 151.8 |
| Recreation and culture | 0.2 | 3.6 | 123.5 |
| Clothing and footwear | 1.0 | 4.0 | 52.6 |
| CPI-ATE (july 1999 = 100) | -0.2 | 2.9 | 131.4 |
| CPI by delivery sector | |||
| Other consumer goods produced in Norway | -0.6 | -2.7 | 159.3 |
| Imported consumer goods | -0.2 | 3.4 | 93.2 |
| Other services with wages as dominating price factor | 0.6 | 3.0 | 216.9 |

The year-to-year CPI-ATE growth was 2.9 per cent in August. The CPI was 139.7 (1998=100) in August 2015, compared to 137.0 in August 2014, which corresponds to a year-to-year growth of 2.0 per cent.
Monthly change: lower prices on fuels, food and air travel
The CPI fell 0.1 per cent from July to August, partly due to lower prices on fuels. Petrol prices went down 3.8 per cent, while prices on auto diesel fell 5.5 per cent. The decline in prices on auto diesel is the largest percentual decline in one single month since December 2008.
Another important contributor to this month’s CPI decline was lower food prices. The prices went down 0.9 per cent from July to August after four months of consecutive rising prices. The 0.9 per cent decrease coincides with the average price decrease for this period over the last ten years. Every sub-group except meat, and oils and fats showed a price decrease. Airfares went down 7.8 per cent from July to August, and in the same period household textiles and furniture also recorded lower prices.
The monthly decline in the CPI was mainly dampened by higher electricity prices including grid rent, which increased 4.0 per cent last month. In the same period, prices of clothing showed a price increase, which is unusual for this period. Clothing prices went up 1.3 per cent, probably due to new stock arriving in stores earlier than in previous years, and the weaker Norwegian Krone. Increased prices on dental services and books also curbed the drop in the CPI from July to August.
Year-to-year growth: higher prices of food and furniture
The CPI rose 2.0 per cent from August 2014 to August 2015. The most important factor was that prices of food and non-alcoholic beverages rose by 3.3 per cent over the past twelve months. Food prices alone increased 2.9 per cent, mainly due to higher prices on sugar commodities, fruit and vegetables. Prices on non-alcoholic beverages went up 6.5 per cent in the last twelve months.
Other important factors contributing to the positive year-to-year growth were higher imputed rentals for home owners, and increased prices on furniture and clothing.
Prices on electricity are still significantly lower in August this year than at the same time last year, despite this month’s increase. Lower prices on fuels and telephone services also contributed to a dampening of the growth in the CPI in the last twelve months.
Change in the year-to-year growth: slightly up from July to August
The year-to-year growth in the CPI increased from 1.8 per cent in July to 2.0 per cent in August. The increased growth rate was mainly due to the price development in clothing, furniture and food. Prices on clothing rose 1.3 per cent from July to August this year, while falling 2.7 per cent in the same period last year. Prices on furniture and food fell less from July to August this year than they did in the same period in the previous year.
The price development of fuels pulled in the opposite direction, as they fell significantly more from July to August in 2015 than they did in the same period in 2014.
The year-to-year growth in the CPI-ATE was 2.9 per cent in August; up 0.3 percentage points from July. This was mainly due to the aforementioned price development in clothing, furniture and food.
Contact
-
Statistics Norway's Information Centre
E-mail: informasjon@ssb.no
tel.: (+47) 21 09 46 42
-
Konsumprisindeksen
E-mail: konsumprisindeksen@ssb.no
tel.: (+47) 62 88 56 34
-
Camilla Rochlenge
E-mail: camilla.rochlenge@ssb.no
tel.: (+47) 40 90 23 72
-
Kjersti Nyborg Hov
E-mail: kjersti.nyborg.hov@ssb.no
tel.: (+47) 40 90 23 63
-
Gunnar Larsson
E-mail: gunnar.larsson@ssb.no
tel.: (+47) 40 90 26 79
-
Trym Kristian Økland
E-mail: trym.okland@ssb.no
tel.: (+47) 46 81 09 15
