Content
Published:
This is an archived release.
Sharp rise in electricity prices
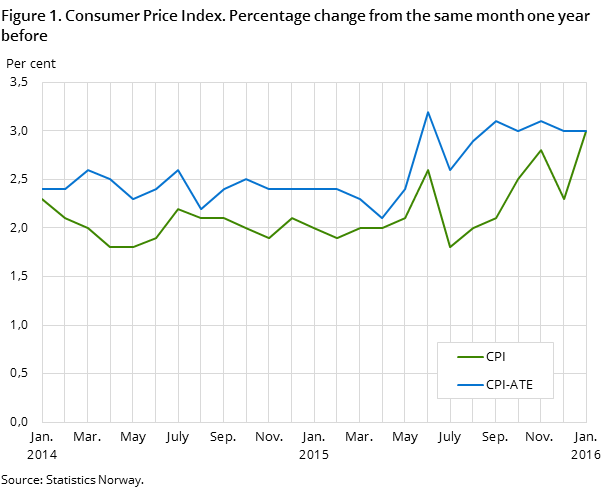
The Consumer Price Index (CPI) rose 0.6 per cent from December 2015 to January 2016, mostly due to higher electricity prices. The year-to-year growth in the CPI was 3.0 per cent in January, up 0.7 percentage points from December.
| Monthly change (per cent) December 2015 - January 2016 | 12-month rate (per cent) January 2015 - January 2016 | Index January 2016 | |
|---|---|---|---|
| CPI All-item index | 0,6 | 3,0 | 142,0 |
| Food and non-alcoholic beverages | 0,3 | 1,8 | 131,3 |
| Housing, water, electricity, gas and other fuels | 3,0 | 3,0 | 176,9 |
| Transport | 0,3 | 1,5 | 151,1 |
| Recreation and culture | 0,2 | 4,8 | 126,8 |
| Clothing and footwear | -4,9 | 5,5 | 53,9 |
| CPI-ATE (July 1999 = 100) | -0,1 | 3,0 | 132,4 |
| CPI by delivery sector (December 2014 = 100) | |||
| Consumer goods | 0,6 | 3,5 | 103,1 |
| Services | 0,6 | 2,5 | 102,9 |
| Services where labor dominates | 0,6 | 2,5 | 103,7 |

The year-to-year CPI-ATE growth was 3.0 per cent in January. CPI-AT rose 2.9 per cent in the same period. The CPI was 142.0 (1998=100) in January 2016, compared to 137.8 in January 2015, which corresponds to a year-to-year growth of 3.0 per cent.
Monthly change: electricity prices behind positive monthly change
The CPI increased 0.6 per cent from December last year to January this year. This is the highest January increase in the CPI since 2003. As in 2003, the main factor was a significant rise in electricity prices. Prices of electricity including grid rent rose 20.0 per cent last month, and the price level is at its highest since May 2011. Electricity prices and grid rent both increased last month. The higher grid rent has to be viewed in conjunction with the increased grid rent tax effective from 1 January 2016. Cold weather in large parts of Norway during January led electricity spot prices to double in some price areas last month.
CPI-AEL (CPI without electricity) went up 0.1 per cent from December to January.
Prices on cultural services rose 4.9 per cent last month, partly due to the 2 percentage point increase in VAT in January. Increased prices of sugar goods, cars, household textiles and alcohol and tobacco also contributed in the CPI increase from December to January. CPI-AT rose 0.4 per cent in the same period.
The incline in the CPI was mainly dampened by a price decrease of 5.0 per cent on clothing, due to the annual January sales. Sales activities also led to lower prices on furniture. A price decrease was also recorded for fruit, airfares and books.
Year-to-year growth: higher prices on electricity and clothes
The CPI rose 3.0 per cent from January 2015 to January 2016. Higher electricity prices were the largest contributor to the year-to-year growth with a price increase of 12.1 per cent. Prices on clothing rose 6.4 per cent over the last twelve months. This is the highest year-to-year growth for almost 30 years. Other contributing factors were price increases of furniture, alcohol and tobacco and restaurant services.
The year-to-year growth in the CPI was mainly dampened by lower fuel prices. Auto diesel and petrol prices fell 6.8 and 3.5 per cent respectively.
Change in the year-to-year growth: electricity prices pulled the growth rate up
The year-to-year growth in the CPI increased from 2.3 per cent in December to 3.0 per cent in January. The increased growth rate was mainly due to the development in prices of electricity including grid rent, which rose 20 per cent from December 2015 to January 2016, while increasing only 0.6 per cent from December 2014 to January 2015.
The price development of food pulled the growth rate in the opposite direction, as prices rose less from December 2015 to January 2016 than from December 2014 to January 2015.
The year-to-year growth in the CPI-ATE was 3.0 per cent in January, the same as in December.
Changes in the CPI in 2016
As of the index for January 2016, some methodological changes are made in the CPI. These changes are not assumed to have any systematic effect on the calculation of the CPI. Read more about this in the boxes below.
New weights, goods and services. Enhanced consumer classification.Open and readClose
• The weights in the CPI are updated every January based on NA figures. The sample of goods and services in the CPI is also updated. See weights in CPI (table 5)
• Enhanced consumer classification. Eurostat’s new 5 digit consumer classification (ECOICOP) has been implemented. Some goods and services in the CPI have moved from one group to another resulting in interrupted time series. Detailed groups within food and non-alcoholic beverages (coicop 01) in particular have changes.
New CPI delivery sector. Enhanced price collection period.Open and readClose
• A new version of the price development in the CPI by the delivery sector has been implemented. This is more in line with the development in the economy and will enable a more detailed analysis of the origins of price impulses. It will be possible to compare goods versus services and Norwegian goods versus imported goods.
• The period of measuring prices on groceries is enhanced from one week to three weeks. This applies to scanner data supplied by the grocery chains.
Contact
-
Statistics Norway's Information Centre
E-mail: informasjon@ssb.no
tel.: (+47) 21 09 46 42
-
Konsumprisindeksen
E-mail: konsumprisindeksen@ssb.no
tel.: (+47) 62 88 56 34
-
Camilla Rochlenge
E-mail: camilla.rochlenge@ssb.no
tel.: (+47) 40 90 23 72
-
Kjersti Nyborg Hov
E-mail: kjersti.nyborg.hov@ssb.no
tel.: (+47) 40 90 23 63
-
Gunnar Larsson
E-mail: gunnar.larsson@ssb.no
tel.: (+47) 40 90 26 79
-
Trym Kristian Økland
E-mail: trym.okland@ssb.no
tel.: (+47) 46 81 09 15
