Content
Published:
This is an archived release.
Price fall for clothing and furniture
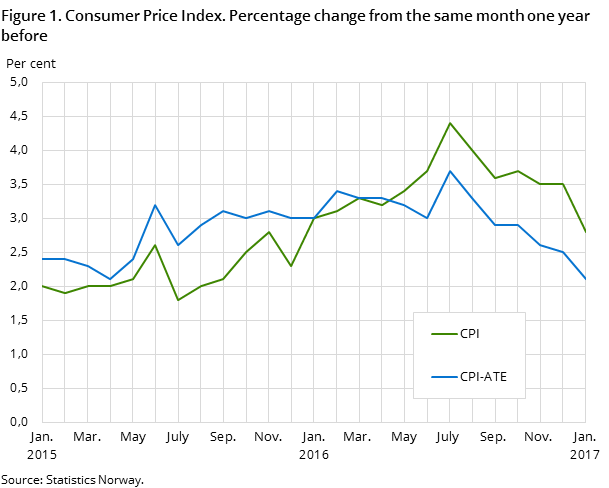
The Consumer Price Index (CPI) fell 0.1 per cent from December 2016 to January 2017. The year-to-year growth in the CPI was 2.8 per cent in January, down 0.7 percentage points from December.
| Index | Monthly change (per cent) | 12-month rate (per cent) | |
|---|---|---|---|
| January 2017 | December 2016 - January 2017 | January 2016 - January 2017 | |
| CPI All-item index | 104.3 | -0.1 | 2.8 |
| Food and non-alcoholic beverages | 100.9 | 0.6 | 2.0 |
| Alcoholic beverages and tobacco | 104.3 | 1.4 | 2.0 |
| Clothing and footwear | 98.6 | -9.2 | -1.2 |
| Housing, water, electricity, gas and other fuels | 107.1 | 0.5 | 3.0 |
| Furnishings, household equipment and routine maintenance | 102.7 | -3.3 | 1.3 |
| Health | 103.4 | -0.8 | 3.3 |
| Transport | 104.2 | 1.7 | 4.1 |
| Communications | 105.3 | 0.0 | 2.7 |
| Recreation and culture | 106.3 | -0.3 | 3.4 |
| Education | 107.0 | 0.0 | 5.3 |
| Restaurants and hotels | 105.5 | 0.6 | 3.9 |
| Miscellaneous goods and services | 103.1 | 0.8 | 2.0 |
| CPI-ATE All-item index | 103.1 | -0.5 | 2.1 |
| CPI by delivery sector | |||
| Consumer goods | 104.3 | -0.9 | 2.6 |
| Services | 104.3 | 0.6 | 2.9 |
| Services where labor dominates | 104.6 | 0.5 | 3.1 |

The CPI-ATE rose 2.1 per cent from January 2016 to January 2017. CPI was 104.3 (2015 = 100) in January 2017, compared to 101.5 in January 2016, which corresponds to a year-to-year growth of 2.8 per cent.
Monthly change: Sales activity on clothing and furniture
From December last year to January this year, the CPI fell 0.1 per cent, mostly due to widespread sales activity on clothing and furniture. Prices on clothing fell 9.6 per cent while prices of furniture and furnishings fell 9.7 per cent in the period. Prices on footwear fell 6.3 per cent in the same period. The prices of package holidays are measured each quarter, and showed a price decrease by 4.0 per cent.
Fuels and lubricants contributed most to dampening the CPI decrease from December to January. Petrol- and auto diesel prices have shown a gradual increase the last three months with the highest change in January were prices rose 6.0 and 6.8 per cent respectively. The price increase must be seen in conjunction with the tax increase implemented in January.
After repeatedly decreases on food prices the last months, a monthly increase of 0.6 per cent were registered in January.
The CPI-AT fell 0.3 per cent from December last year to January this year. The tax increases hence contributed to rising the CPI up with 0.2 percentage points.
Year-to-year growth: Increasing energy prices
From January 2016 to January 2017, the CPI increased by 2.8 per cent mainly due to higher energy prices. Fuels and lubricants and electricity including grid rent rose 11 and 7.8 per cent respectively in the period. The prices of fuel have shown negative year-to-year growth since September 2014, but from November 2016 the trend turned to an increasing positive growth.
Change in the year-to-year growth: electricity prices pulled the growth rate down
The year-to-year growth in the CPI went down from 3.5 per cent in December 2016 to 2.8 per cent in January 2017. The negative change in the year-to-year growth was mainly caused by the development in prices of electricity including grid rent, which rose 19.9 per cent from December 2015 to January 2016, while increasing only 0.4 per cent from January 2016 to January 2017. The price development on clothing also contributed to the negative growth change.
The price development on fuels and lubricants together with airfares pulled the growth rate in the opposite direction.
New weights, enhanced price collection period and wider selection of goods and services in the CPIOpen and readClose
The weights in the CPI are updated every January based on NA figures. The sample of goods and services in the CPI is also updated. See weights in CPI (table 5).
As of January 2017 the selection of goods is enhanced for price indices of non-food from grocery outlets, - a result of better utilization of scanner data from grocery chains. The price index of airline fares has been extended with prices for 2 more departure days in connection with weekends per month. In addition , the price index for passenger transport by railway is greatly expanded both in terms of the measurement period and range.
New detailed consumer classification, ECOICOPOpen and readClose
The CPI adopted Eurostat’s new detailed 5-digit consumer classification, ECOICOP in January 2016. Statistics Norway has published unofficial 5 and 6-digit COICOP indices for the consumer group Food and non-alcoholic beverages up until January 2016. As a result of a discrepancy between the unofficial and the new official ECOICOP, some previously published indices are no longer available. This results in new names for some of the published groups.
Representative goods and services in the CPI by delivery sectorOpen and readClose
Here is the detailed list of representative goods and services in the CPI by delivery sector. The list will not be automatically updated
Contact
-
Statistics Norway's Information Centre
E-mail: informasjon@ssb.no
tel.: (+47) 21 09 46 42
-
Konsumprisindeksen
E-mail: konsumprisindeksen@ssb.no
tel.: (+47) 62 88 56 34
-
Camilla Rochlenge
E-mail: camilla.rochlenge@ssb.no
tel.: (+47) 40 90 23 72
-
Kjersti Nyborg Hov
E-mail: kjersti.nyborg.hov@ssb.no
tel.: (+47) 40 90 23 63
-
Gunnar Larsson
E-mail: gunnar.larsson@ssb.no
tel.: (+47) 40 90 26 79
-
Trym Kristian Økland
E-mail: trym.okland@ssb.no
tel.: (+47) 46 81 09 15
