Content
Published:
This is an archived release.
Prices of energy products up
The price index of first-hand domestic sales increased by 1 per cent from March to April. This is primarily due to a price increase in the group mineral fuels, lubricants and related materials.
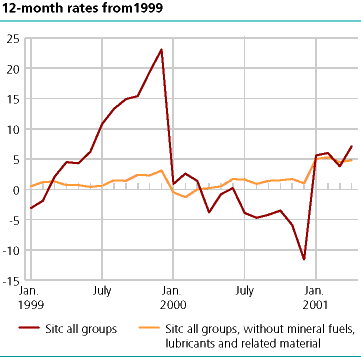
The 12-month rate (April 2000 - April 2001) of the total index was 7.1 per cent after 3.8 per cent in March.
Price development from March to April: Petroleum prices up
Once more the prices of petroleum and petroleum products contributed the most, by increasing 4.7 per cent. With that, the group containing these products mineral fuels, lubricants and related material increased 3.2 per cent. Machinery and transport equipment went up 2.1 per cent, mainly due to price growth for vehicles. But also computers contributed in this group.
The greatest downward pull came from a 0.8 per cent fall in prices of manufactured goods classified by material.
The 12-month rate: More expensive energy
The total index rose by 7.1 per cent, chiefly due to a strong price increase of 17.8 per cent for the mineral fuels, lubricants and related material.
Other contributions came from food and live animals, and machinery and transport equipment. Within the first group the price increase of fish was the most important, while in the other group the most important price change was for vehicles.
Changes in the 12-month rate: Nearly a doubling
The 12-month rate went from 3.8 per cent to 7.1 per cent in April. The overall change was mainly caused by higher prices of petroleum and petroleum products, which brought the prices of the group mineral fuels, lubricants and related material from 1.4 per cent in March to 17.8 per cent in April.
This time we have computed an index free from the group mineral fuels, lubricants and related material back to 2000.
In this figure the significance of the energy products is demonstrated. Throughout 1999 the price of crude oil more than doubled, which also brought the prices of petroleum products up. The price of electricity fell from December 1999 and the following month, while the price development was opposite in 2001. This is some of the explanation behind the figure.
| Price index of first-hand domestic sales. 2000=100 |
| April 2001 | Changes, per cent | ||||||||||||||||||||||||||||||||||||||
|---|---|---|---|---|---|---|---|---|---|---|---|---|---|---|---|---|---|---|---|---|---|---|---|---|---|---|---|---|---|---|---|---|---|---|---|---|---|---|---|
|
March 2001-
April 2001 |
April 2000-
April 2001 |
||||||||||||||||||||||||||||||||||||||
| Total index | 102,42 | 1,0 | 7,1 | ||||||||||||||||||||||||||||||||||||
| Food and live animals | 104,29 | 0,4 | 5,8 | ||||||||||||||||||||||||||||||||||||
| Beverages and tobacco | 99,44 | -0,1 | 0,0 | ||||||||||||||||||||||||||||||||||||
| Crude materials, inedible, except fuels | 101,68 | -1,1 | 5,8 | ||||||||||||||||||||||||||||||||||||
| Mineral fuels, lubricants and related materials | 98,11 | 3,2 | 17,8 | ||||||||||||||||||||||||||||||||||||
| Chemicals and related products, n.e.s | 103,39 | 0,5 | 3,5 | ||||||||||||||||||||||||||||||||||||
| Manufactured goods classified by material | 101,78 | -0,8 | 3,1 | ||||||||||||||||||||||||||||||||||||
| Machinery and transport equipment | 103,04 | 2,1 | 3,8 | ||||||||||||||||||||||||||||||||||||
| Miscellaneous manufactured articles | 101,31 | 0,2 | 1,4 | ||||||||||||||||||||||||||||||||||||
Additional information
Contact
-
Producer price index
E-mail: produsentpris@ssb.no
tel.: (+47) 21 09 40 00
-
Elisabeth Mælum
E-mail: elisabeth.maelum@ssb.no
tel.: (+47) 97 01 28 49
-
Monika Græsli Engebretsen
E-mail: monika.graesli.engebretsen@ssb.no
tel.: (+47) 40 90 23 71
-
Morten Madshus
E-mail: morten.madshus@ssb.no
tel.: (+47) 40 90 26 94

