Content
Published:
This is an archived release.
Electricity prices keep falling
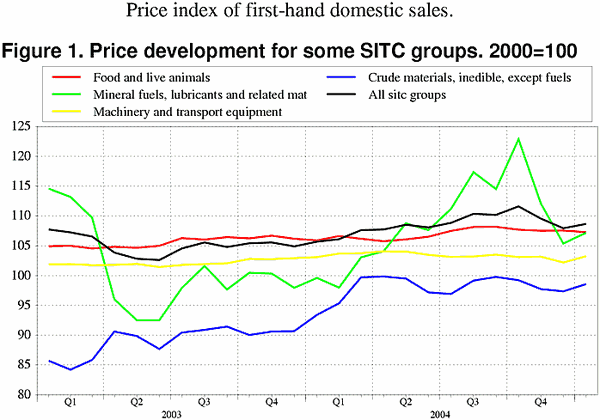
The total index increased 0.7 per cent the last month. The groups that contributed most to the increase were petroleum and petroleum products, and metalliferous ores and metal scrap. While the decrease in food and electricity prices slowed down the general price increase.
All the main groups, except foods increased in January 2005. Prices of mineral fuels, lubricants and related materials increased by 1.7 per cent from December to January. Prices of petroleum and petroleum products increased by 7.4 while electricity decreased by 11.6 per cent.
Satisfactory levels in the water depots and mild weather were the main reasons for the drop in electricity prices.
Crude materials increased by 1.3 per cent mostly due to higher prices for fertilizers and crude minerals prices. Prices of food showed a decrease of 0.3 per cent. In this group fruits and vegetables stood for the price increase due to season related variations.
The overall domestic market showed a price increase of 0.4 per cent mostly due to an increase in prices for petroleum and petroleum products by 6.7 per cent.
The 12-month rate, January 2004 to January 2005: 2.8 per cent increase
The overall 12-month rate showed that prices have increased by 2.8 per cent.
The increase was mainly due to higher prices in all the main groups, except machinery and transport equipment. Petroleum and petroleum products went up 19.4 per cent. Crude materials went up 5.6 per cent, due to higher prices of metalliferous ores and metal scrap.
Prices of food increased by 1.3 per cent compared with figures from January 2004, caused by higher prices of fish, dairy products, sugar, and coffee.
Manufactured goods increased by 5.6 per cent. The main reason was higher prices of iron and steel, up 31.7 per cent.
Updated weights for 2005
The weights used in the Index are revised with new figures from The National Accounts. Increased figures for sale of iron and steel result in increased weights for manufactured goods, while mineral fuels, lubricants and related materials have lower figures and respectively lower weights. The production of electric current is causing this development. On the domestic marked food, beverages, tobacco and manufactured goods become more important for the overall development, while the rest of the main groups loose weight.
| Price index of first-hand domestic sales. 2000=100 |
| December 2004 | Changes, per cent | ||||||||||||||||||||||||||||||||||||||
|---|---|---|---|---|---|---|---|---|---|---|---|---|---|---|---|---|---|---|---|---|---|---|---|---|---|---|---|---|---|---|---|---|---|---|---|---|---|---|---|
|
November 2004-
December 2004 |
December 2003-
December 2004 |
||||||||||||||||||||||||||||||||||||||
| Total index | 107.9 | -1.6 | 2.9 | ||||||||||||||||||||||||||||||||||||
| Food and live animals | 107.6 | 0.1 | 1.3 | ||||||||||||||||||||||||||||||||||||
| Beverages and tobacco | 109.9 | -0.4 | 2.8 | ||||||||||||||||||||||||||||||||||||
| Crude materials, inedible, except fuels | 97.3 | -0.5 | 7.3 | ||||||||||||||||||||||||||||||||||||
| Mineral fuels, lubricants and related materials | 105.4 | -6.0 | 7.7 | ||||||||||||||||||||||||||||||||||||
| Chemicals and related products, n.e.s | 106.4 | -0.3 | 1.7 | ||||||||||||||||||||||||||||||||||||
| Manufactured goods classified by material | 105.0 | -0.4 | 5.8 | ||||||||||||||||||||||||||||||||||||
| Machinery and transport equipment | 102.2 | -1.0 | -0.7 | ||||||||||||||||||||||||||||||||||||
| Miscellaneous manufactured articles | 103.3 | -1.6 | 1.0 | ||||||||||||||||||||||||||||||||||||
Additional information
Contact
-
Producer price index
E-mail: produsentpris@ssb.no
tel.: (+47) 21 09 40 00
-
Elisabeth Mælum
E-mail: elisabeth.maelum@ssb.no
tel.: (+47) 97 01 28 49
-
Monika Græsli Engebretsen
E-mail: monika.graesli.engebretsen@ssb.no
tel.: (+47) 40 90 23 71
-
Morten Madshus
E-mail: morten.madshus@ssb.no
tel.: (+47) 40 90 26 94

