Content
Published:
This is an archived release.
Increase in electricity prices
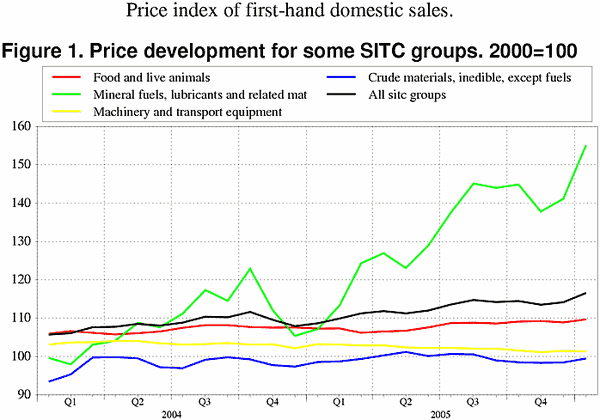
The price index of first-hand domestic sales increased by 2.1 per cent in January. The electricity spot prices went up by 22 per cent from December 2005 to January 2006 according to the monthly mean price from NordPool. The prices on petroleum products did also rise during the last month.
Food prices were influenced by the increase in fruit and vegetable prices and increased by 0.7 per cent after a decrease in December. Beverage prices and prices on crude materials increased as well, 2.8 and 1 per cent respectively. The prices on petroleum products went up by 10 per cent in January. Electricity prices are on their highest level since February 2003 according to NordPool.
Prices on machinery and transport equipment decreased by 0.1 per cent. The most important groupings decreased. Prices on office machines, data processing machines decreased by 1 per cent from December to January.
The prices related to the domestic production increased by 3.7 per cent compared to December. The energy price increase is the most important reason for this increase.
The 12-month rate, January 2005 to January 2006: up 7.3 per cent
The last twelve months the price index of first-hand domestic sales increased by 7.3 per cent. Prices on energy goods are the main contributors to the increase this period. Electricity prices and prices of petroleum products increased by 48.7 and 46.8 per cent respectively. Food prices increased by 2.2 per cent and prices on machinery and transport equipment decreased by 1.7 per cent compared to January 2005.
The twelve-month rate for the prices related to the domestic production increased by 10.7 per cent compared to January 2005. This is due to the increase in electricity prices and prices of petroleum products.
| Price index of first-hand domestic sales. 2000=100 |
| January 2006 | Changes in per cent | ||||||||||||||||||||||||||||||||||||||
|---|---|---|---|---|---|---|---|---|---|---|---|---|---|---|---|---|---|---|---|---|---|---|---|---|---|---|---|---|---|---|---|---|---|---|---|---|---|---|---|
|
December 2005-
January 2006 |
January 2005-
January 2006 |
||||||||||||||||||||||||||||||||||||||
| Total index | 116.6 | 2.1 | 7.3 | ||||||||||||||||||||||||||||||||||||
| Food and live animals | 109.7 | 0.7 | 2.2 | ||||||||||||||||||||||||||||||||||||
| Beverages and tobacco | 114.0 | 2.4 | 3.2 | ||||||||||||||||||||||||||||||||||||
| Crude materials, inedible, except fuels | 99.4 | 1.0 | 0.8 | ||||||||||||||||||||||||||||||||||||
| Mineral fuels, lubricants and related materials | 155.2 | 10.0 | 44.8 | ||||||||||||||||||||||||||||||||||||
| Chemicals and related products, n.e.s. | 108.0 | 0.1 | 1.4 | ||||||||||||||||||||||||||||||||||||
| Manufactured goods classified by material | 109.1 | 0.8 | 2.8 | ||||||||||||||||||||||||||||||||||||
| Machinery and transport equipment | 101.4 | -0.1 | -1.7 | ||||||||||||||||||||||||||||||||||||
| Miscellaneous manufactured articles | 102.7 | -0.4 | -0.8 | ||||||||||||||||||||||||||||||||||||
Updated weights for 2006
The weights used in the index are revised with new figures from The National Accounts. These updates increase the part of mineral fuels, lubricants and electricity in the index in 2006. This is mostly due to the high turnover figures in the petroleum industry. The food prices relative influence of the index decreased 22.8 per cent, while chemical products' importance increases, in particular because of the increased import value and turnover in the pharmaceutical industry. The same trends are seen for the domestic production of goods.
Additional information
Contact
-
Producer price index
E-mail: produsentpris@ssb.no
tel.: (+47) 21 09 40 00
-
Elisabeth Mælum
E-mail: elisabeth.maelum@ssb.no
tel.: (+47) 97 01 28 49
-
Monika Græsli Engebretsen
E-mail: monika.graesli.engebretsen@ssb.no
tel.: (+47) 40 90 23 71
-
Morten Madshus
E-mail: morten.madshus@ssb.no
tel.: (+47) 40 90 26 94

