Content
Published:
This is an archived release.
Increase in petroleum prices
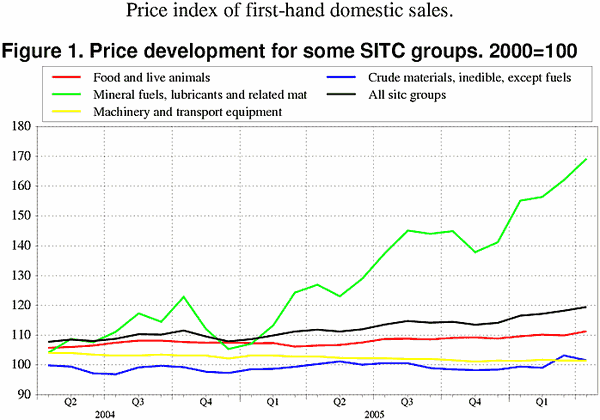
The prices of petroleum and petroleum products increased by 7.5 per cent from March to April. In addition food prices increased by 1.3 per cent. This lead to an increase in the price index of domestic sales of 1.1 per cent over the last month.
From March to April the prices on mineral fuels, lubricants and electricity went up 4.4 per cent. The reason for the rise was the continuing increase in prices of petroleum and petroleum products. The spot price of crude oil (Brent Blend) increased by 11 per cent and influenced the prices of all its derivatives. Prices in this product group have reached an all-time high, with a rise of 70 per cent since December 2004. Electricity prices decreased by 1.9 per cent from March to April 2006, a correction after a continual growth of 52 per cent from November 2005 to March 2006.
The price index related to food prices was mainly influenced by fish and vegetable prices and increased 1.3 per cent from March to April. Prices of cereals decreased eith 1.5 per cent.
Prices on chemical products and manufactured goods increased, by 0.2 and 0.3 per cent respectively from March to April. Crude material prices decreased by 1.6 per cent, while prices on transport equipment were stable.
Prices on goods produced in Norway increased 2.0 per cent. One reason for the higher growth in this share of the index was that domestically produced crude materials went up 1.5 per cent while the price index for the aggregate of home production and imports fell. Other reasons for a higher monthly growth rate was that prices on mineral fuels, lubricants and electricity grew more on the domestic market.
The 12-month rate, April 2005 to April 2006: Boom in energy prices, index up 6,8 per cent
Over the last twelve months energy prices have increased continuously and influences the index upwards. Electricity prices increased 47.8 per cent while prices of petroleum and petroleum products, increased 30.9 per cent. Prices on non-ferrous metals have also grown over the past twelve months - by 43.8 per cent.
Prices on goods originating from Norwegian production increased by 11.0 over the last twelve-month period.
| Price index of first-hand domestic sales. 2000=100 |
| April 2006 | Changes in per cent | ||||||||||||||||||||||||||||||||||||||
|---|---|---|---|---|---|---|---|---|---|---|---|---|---|---|---|---|---|---|---|---|---|---|---|---|---|---|---|---|---|---|---|---|---|---|---|---|---|---|---|
|
March 2006-
April 2006 |
April 2005-
April 2006 |
||||||||||||||||||||||||||||||||||||||
| Total index | 119.5 | 1.1 | 6.8 | ||||||||||||||||||||||||||||||||||||
| Food and live animals | 111.3 | 1.3 | 4.5 | ||||||||||||||||||||||||||||||||||||
| Beverages and tobacco | 114.2 | 0.0 | 3.3 | ||||||||||||||||||||||||||||||||||||
| Crude materials, inedible, except fuels | 101.5 | -1.6 | 1.2 | ||||||||||||||||||||||||||||||||||||
| Mineral fuels, lubricants and related materials | 169.2 | 4.4 | 33.2 | ||||||||||||||||||||||||||||||||||||
| Chemicals and related products, n.e.s. | 108.2 | 0.2 | 0.8 | ||||||||||||||||||||||||||||||||||||
| Manufactured goods classified by material | 110.5 | 0.3 | 3.3 | ||||||||||||||||||||||||||||||||||||
| Machinery and transport equipment | 101.5 | 0.0 | -1.4 | ||||||||||||||||||||||||||||||||||||
| Miscellaneous manufactured articles | 103.8 | 0.5 | -0.6 | ||||||||||||||||||||||||||||||||||||
Additional information
Contact
-
Producer price index
E-mail: produsentpris@ssb.no
tel.: (+47) 21 09 40 00
-
Elisabeth Mælum
E-mail: elisabeth.maelum@ssb.no
tel.: (+47) 97 01 28 49
-
Monika Græsli Engebretsen
E-mail: monika.graesli.engebretsen@ssb.no
tel.: (+47) 40 90 23 71
-
Morten Madshus
E-mail: morten.madshus@ssb.no
tel.: (+47) 40 90 26 94

