Content
Published:
This is an archived release.
Cheaper food
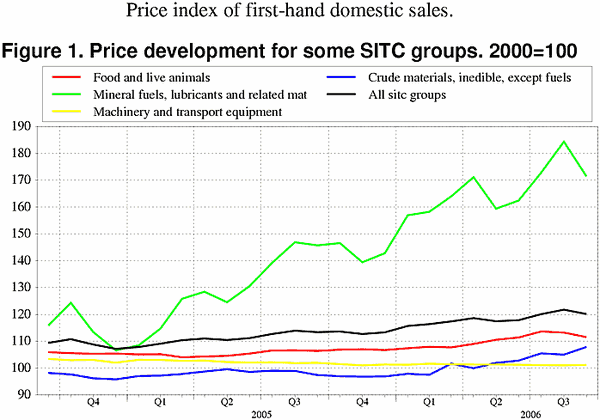
The prices of food and live animals went down by 1.5 per cent from August to September 2006. Together with a drop in the prices of petroleum and petroleum products by 10.4 per cent, this led to a decrease by 1.3 per cent for the price index of first-hand domestic sales.
|
When introducing new methods for calculating the price index for first-hand domestic sales (PIF) in 2000 there arose an unintended inconsistency in the published index series. Statistics Norway has corrected this. See Index level changed for PIF for a more thorough explanation of the situation and steps taken to remedy it. Consequences for the online index calculator are elaborated in this article . |
Once again the prices of energy goods are fluctuating. The prices of crude oil had a downturn in September while the prices of electricity had a moderate fall of 0.9 per cent.
The prices of food products turned down except for the dairy and meat products, which had minor changes only. Fruits and vegetables fell by 7 per cent due to great supply of these products on the domestic market at the moment.
Crude materials, inedible, except fuels increased by 2.7 per cent mainly due to a price increase of metalliferous ores and metal scrap by 5.3 per cent. Prices of Timber had a 0.7 per cent increase while pulp and waste paper increased 2.0 per cent.
Manufactured goods increased by 1.1 per cent mainly due to the increase in metals.
The 12-month rate, September 2005 to September 2006: Up 6 per cent
The price index of first-hand domestic sales rose by 6 per cent from September 2005 to September 2006. Again the prices of energy goods and crude materials are the main contributors to the increase by 17.7 per cent and 10.7 per cent respectively. The oil prices are at the same level as last year while prices of electricity has increased by 88.3 per cent. The prices of iron and steal rose by 10.5 per cent while other metals increased by 44.9 per cent compared to the same period of last year.
| Price index of first-hand domestic sales. 2000=100 |
| September 2006 | Changes, per cent | ||||||||||||||||||||||||||||||||||||||
|---|---|---|---|---|---|---|---|---|---|---|---|---|---|---|---|---|---|---|---|---|---|---|---|---|---|---|---|---|---|---|---|---|---|---|---|---|---|---|---|
|
August 2006-
September 2006 |
September 2005-
September 2006 |
||||||||||||||||||||||||||||||||||||||
| Total index | 120.1 | -1.3 | 6.0 | ||||||||||||||||||||||||||||||||||||
| Food and live animals | 111.5 | -1.5 | 4.9 | ||||||||||||||||||||||||||||||||||||
| Beverages and tobacco | 115.3 | 0.1 | 2.9 | ||||||||||||||||||||||||||||||||||||
| Crude materials, inedible, except fuels | 107.9 | 2.7 | 10.7 | ||||||||||||||||||||||||||||||||||||
| Mineral fuels, lubricants and related materials | 171.4 | -7.0 | 17.7 | ||||||||||||||||||||||||||||||||||||
| Chemicals and related products, n.e.s | 108.4 | 0.0 | 2.8 | ||||||||||||||||||||||||||||||||||||
| Manufactured goods classified by material | 110.6 | 1.1 | 6.4 | ||||||||||||||||||||||||||||||||||||
| Machinery and transport equipment | 101.1 | 0.1 | -0.7 | ||||||||||||||||||||||||||||||||||||
| Miscellaneous manufactured articles | 104.1 | 0.7 | 0.6 | ||||||||||||||||||||||||||||||||||||
Additional information
Contact
-
Producer price index
E-mail: produsentpris@ssb.no
tel.: (+47) 21 09 40 00
-
Elisabeth Mælum
E-mail: elisabeth.maelum@ssb.no
tel.: (+47) 97 01 28 49
-
Monika Græsli Engebretsen
E-mail: monika.graesli.engebretsen@ssb.no
tel.: (+47) 40 90 23 71
-
Morten Madshus
E-mail: morten.madshus@ssb.no
tel.: (+47) 40 90 26 94

