Content
Published:
This is an archived release.
Increased import prices in crude materials
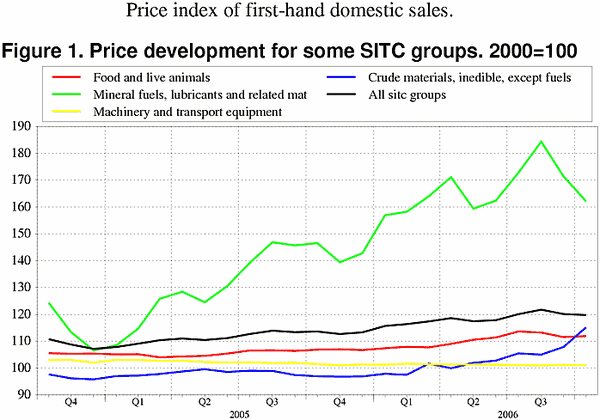
In a month of relatively small price changes, two product groupings stand out. Prices of inedible crude materials rose by 6.7 per cent, while energy goods prices fell 5.4 per cent. In total, the price index of first-hand domestic sales (PIF) is down 0.3 per cent from September to October.
|
When introducing new methods for calculating the price index for first-hand domestic sales (PIF) in 2000, there arose an unintended inconsistency in the published index series. Statistics Norway has corrected this. See this site for a more thorough explanation of the situation and steps taken to remedy it. Consequences for the online index calculator are elaborated here . |
In total, which means goods produced and consumed in Norway plus imported goods, the prices of inedible crude materials increased 6.7 per cent. Except lumber and pulp Norwegian production within this category is sparse, and the crude materials index for the domestic market barely changed. The significant increase stems mainly from the import of metalliferous ores and metal scrap. The index for this sub-group rose 16.5 per cent over the month from September to October, maintaining the index' steep climb since April. Copper and aluminium prices fuelled the development over the spring and summer, but these seem to have levelled off since July, with nickel prices following up with subsequent growth.
Lower energy prices
Prices of energy goods, or "mineral fuel, lubricants and related materials", as is the grouping's full name, decreased 5.4 per cent. The price of electric power has fallen following fear of a power crisis and an accompanying price spike in August, with the electricity index showing a 10.6 per cent decrease from September to October. Compared with October of last year, however, the index has seen a significant jump of 59.7 per cent. Oil prices also fell during the month to October, yielding a 3.3 per cent fall in the index for petroleum and petroleum products.
Due to energy production's relative importance in the Norwegian economy, energy goods prices are heavily weighted when calculating the PIF. Thus, the fall in these prices lead to a slight decrease in the index total despite only two other groupings with slight negative changes.
Vegetables and fruit
Although the index for food and live animals is up a slight 0.3 per cent, the sub-index for vegetables and fruit decreased for the second consecutive month. From August to September it fell with a relatively steep seven per cent, and then 3.8 per cent from September to October. This is a familiar phenomenon in the fall, and compared with October of last year vegetable and fruit prices are up 2.1 per cent.
As mentioned, the large price increase in crude materials was not related to Norwegian production. In addition, the importance of energy goods is even more pronounced in the domestic market than in the total of domestic and import markets, yielding a somewhat larger fall of 1.9 per cent in the index separately measuring the domestic market.
Up 5.4 per cent the last twelve months
From October 2005 to October this year, the PIF increased 5.4 per cent. Over these twelve months prices have increased in the vast majority of sub-groups. Some notable exceptions are oil, medicinal and pharmaceutical products, office and data processing machines, and telecommunication equipment, which have all seen prices fall over the year. Some of the most eye-catching changes have been for electricity, metalliferous ores and metal scrap, and non-ferrous metals, with increases of 59.7, 46.6, and 37.4 per cent, respectively.
| Price index of first-hand domestic sales. 2000=100 |
| October 2006 | Changes, per cent | ||||||||||||||||||||||||||||||||||||||
|---|---|---|---|---|---|---|---|---|---|---|---|---|---|---|---|---|---|---|---|---|---|---|---|---|---|---|---|---|---|---|---|---|---|---|---|---|---|---|---|
| September 2006 - October 2006 | October 2005 - October 2006 | ||||||||||||||||||||||||||||||||||||||
| Total index | 119.7 | -0.3 | 5.4 | ||||||||||||||||||||||||||||||||||||
| Food and live animals | 111.9 | 0.3 | 4.8 | ||||||||||||||||||||||||||||||||||||
| Beverages and tobacco | 115.4 | 0.0 | 2.8 | ||||||||||||||||||||||||||||||||||||
| Crude materials, inedible, except fuels | 115.1 | 6.7 | 18.7 | ||||||||||||||||||||||||||||||||||||
| Mineral fuels, lubricants and related materials | 162.1 | -5.4 | 10.6 | ||||||||||||||||||||||||||||||||||||
| Chemicals and related products, n.e.s | 109.2 | 0.8 | 2.9 | ||||||||||||||||||||||||||||||||||||
| Manufactured goods classified by material | 112.1 | 1.3 | 7.1 | ||||||||||||||||||||||||||||||||||||
| Machinery and transport equipment | 101.1 | -0.1 | -0.3 | ||||||||||||||||||||||||||||||||||||
| Miscellaneous manufactured articles | 103.9 | -0.2 | 0.5 | ||||||||||||||||||||||||||||||||||||
Additional information
Contact
-
Producer price index
E-mail: produsentpris@ssb.no
tel.: (+47) 21 09 40 00
-
Elisabeth Mælum
E-mail: elisabeth.maelum@ssb.no
tel.: (+47) 97 01 28 49
-
Monika Græsli Engebretsen
E-mail: monika.graesli.engebretsen@ssb.no
tel.: (+47) 40 90 23 71
-
Morten Madshus
E-mail: morten.madshus@ssb.no
tel.: (+47) 40 90 26 94

