Content
Published:
This is an archived release.
Fall in energy prices
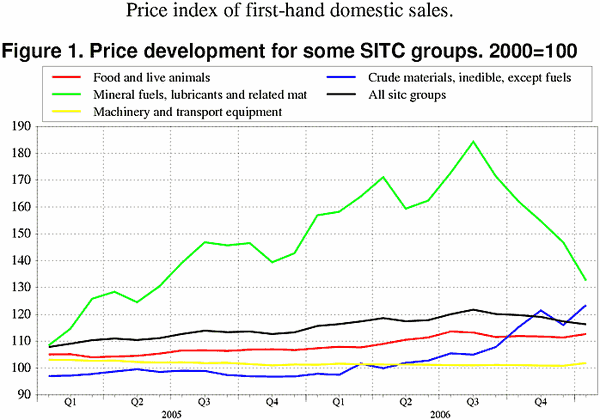
The price index of first-hand domestic sales fell 0.9 per cent in total from December 2006 to January 2007. The main reason was a drop in prices of energy goods. Prices of chemicals were down as well, while crude materials and food prices increased.
The prices of mineral fuels, lubricants and related material fell 9.6 per cent. As opposed to the previous month, petroleum and petroleum products experienced a decrease in prices from December to January. The main reasons for the development were higher oil reserves compared with last winter combined with mild weather. The weather in the first weeks of January also caused prices of electricity to fall for the fifth consecutive month. Higher prices of wood and lumber and metalliferous ores and metal scrap caused the index for crude materials to increase by 6.3 per cent. Prices of wood and lumber also showed a relatively high increase of 5.2 per cent. Strong demand for lumber due to high growth in the construction industry was likely the main reason for the development. The index for food prices rose as well in January, mainly due to higher prices of fish, vegetables and fruit.
The 12-month rate, January 2006 to January 2007: Up 0.5 per cent
The price index of first-hand domestic sales rose by 0.5 per cent from January 2006 to January 2007. All main groupings showed an increase, except energy goods and manufactured goods. Prices of food contributed to the development with an increase of 5.1 per cent, most strongly influenced by higher prices of fish and feeding stuff for animals. A rise in the crude materials index was caused by higher prices in metalliferous ores and metal scrap. Since last year, energy goods have experienced a strong price fall.
Change in index weights
The price index is calculated as a weighted average of observed price changes. The weights used are intended to reflect different industries share in total production and import of manufactured products and intermediate and energy goods. To accommodate for the changing balance between different industries, the weights are updated each year and introduced in January. The weights for 2007 do not differ much from those for 2006. Due to the high prices of energy goods through 2006, these have an increased share of influence in the index. Chemical products also increase their share. These changes come at the expense mainly of the shares of food products, machinery and crude materials.
|
When introducing new methods for calculating the price index for first-hand domestic sales (PIF) in 2000, an unintended inconsistency arose in the published index series. Statistics Norway has corrected this. See this site for a more thorough explanation of the situation and steps taken to remedy it. Consequences for the online index calculator are elaborated here . |
| Price index of first-hand domestic sales. 2000=100 |
| January 2007 | Changes, per cent | ||||||||||||||||||||||||||||||||||||||
|---|---|---|---|---|---|---|---|---|---|---|---|---|---|---|---|---|---|---|---|---|---|---|---|---|---|---|---|---|---|---|---|---|---|---|---|---|---|---|---|
|
December 2006-
January 2007 |
January 2006-
January 2007 |
||||||||||||||||||||||||||||||||||||||
| Total index | 116.2 | -0.9 | 0.5 | ||||||||||||||||||||||||||||||||||||
| Food and live animals | 112.7 | 1.2 | 4.9 | ||||||||||||||||||||||||||||||||||||
| Beverages and tobacco | 115.4 | -0.4 | 0.9 | ||||||||||||||||||||||||||||||||||||
| Crude materials, inedible, except fuels | 123.4 | 6.3 | 26.2 | ||||||||||||||||||||||||||||||||||||
| Mineral fuels, lubricants and related materials | 132.6 | -9.6 | -15.5 | ||||||||||||||||||||||||||||||||||||
| Chemicals and related products, n.e.s | 109.0 | -0.2 | 2.5 | ||||||||||||||||||||||||||||||||||||
| Manufactured goods classified by material | 113.6 | 0.9 | 5.5 | ||||||||||||||||||||||||||||||||||||
| Machinery and transport equipment | 101.8 | 1.0 | 0.6 | ||||||||||||||||||||||||||||||||||||
| Miscellaneous manufactured articles | 102.2 | -0.1 | -0.7 | ||||||||||||||||||||||||||||||||||||
Additional information
Contact
-
Producer price index
E-mail: produsentpris@ssb.no
tel.: (+47) 21 09 40 00
-
Elisabeth Mælum
E-mail: elisabeth.maelum@ssb.no
tel.: (+47) 97 01 28 49
-
Monika Græsli Engebretsen
E-mail: monika.graesli.engebretsen@ssb.no
tel.: (+47) 40 90 23 71
-
Morten Madshus
E-mail: morten.madshus@ssb.no
tel.: (+47) 40 90 26 94

