Content
Published:
This is an archived release.
Energy prices bounce back
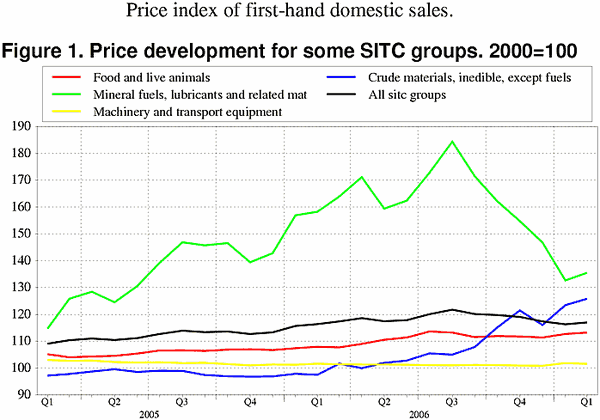
The price index of first-hand domestic sales (PIF) increased for the first time in six months, with a slight rise of 0.6 per cent from January to February, mainly due to the prices of electricity and petroleum.
Until January the PIF, the price index measuring prices of goods at the point of Norwegian producers and importers, fell for five consecutive months. The development was to a large extent driven by the slump in prices of electricity and oil and petroleum products. From January to February, however, these prices bounced back somewhat and contributed to an increase of 0.6 per cent in the total index. The sub-indices for electricity and petroleum prices increased by 2.2 and 2.4 per cent, respectively.
Good times for wood and lumber
Over several past months there has been a relatively strong growth in prices of wood and lumber. This sub-index rose by 5.2 per cent in January and 4.1 per cent in February, the two highest monthly rates in more than ten years. Since July of 2006, the index has increased by 15.3 per cent. High demand from construction in European and Asian markets is likely to have fuelled the unusually large price movement.
Prices of iron and steel were largely unchanged from January to February, while the index for other metals fell by 3.4 per cent, primarily due to prices of zinc and aluminium.
The index for machinery and transport equipment dropped 0.3 per cent from January to February. Within this group, prices were down for industrial machinery, office machinery (computers, printers and the like), telecommunications equipment and electrical machinery. Road vehicles, however, saw a slight price increase of 0.1 per cent.
The twelve-month rate: 0.6 per cent up
Following the rise in energy prices in the first half of 2006, their peak in the late summer and the subsequent decrease, the price index is up only 0.6 per cent since February of last year. The groupings with the largest changes are inedible crude materials (except fuels) and mineral fuels and related materials, with index changes of 29.1 and -14.4, respectively. The former is dominated by developments in prices of lumber and ore, while the latter's fall is due to the drop in oil and electricity prices compared with February of last year.
| Price index of first-hand domestic sales. 2000=100 |
| February 2007 | Changes, per cent | ||||||||||||||||||||||||||||||||||||||
|---|---|---|---|---|---|---|---|---|---|---|---|---|---|---|---|---|---|---|---|---|---|---|---|---|---|---|---|---|---|---|---|---|---|---|---|---|---|---|---|
| January 2007 - February 2007 | February 2006 - February 2007 | ||||||||||||||||||||||||||||||||||||||
| Total index | 117.0 | 0.6 | 0.6 | ||||||||||||||||||||||||||||||||||||
| Food and live animals | 113.2 | 0.4 | 4.9 | ||||||||||||||||||||||||||||||||||||
| Beverages and tobacco | 115.2 | -0.2 | 0.5 | ||||||||||||||||||||||||||||||||||||
| Crude materials, inedible, except fuels | 125.8 | 1.9 | 29.1 | ||||||||||||||||||||||||||||||||||||
| Mineral fuels, lubricants and related materials | 135.5 | 2.1 | -14.4 | ||||||||||||||||||||||||||||||||||||
| Chemicals and related products, n.e.s | 108.9 | -0.1 | 1.9 | ||||||||||||||||||||||||||||||||||||
| Manufactured goods classified by material | 113.8 | 0.2 | 4.7 | ||||||||||||||||||||||||||||||||||||
| Machinery and transport equipment | 101.5 | -0.3 | -0.1 | ||||||||||||||||||||||||||||||||||||
| Miscellaneous manufactured articles | 102.8 | 0.6 | -0.6 | ||||||||||||||||||||||||||||||||||||
Additional information
Contact
-
Producer price index
E-mail: produsentpris@ssb.no
tel.: (+47) 21 09 40 00
-
Elisabeth Mælum
E-mail: elisabeth.maelum@ssb.no
tel.: (+47) 97 01 28 49
-
Monika Græsli Engebretsen
E-mail: monika.graesli.engebretsen@ssb.no
tel.: (+47) 40 90 23 71
-
Morten Madshus
E-mail: morten.madshus@ssb.no
tel.: (+47) 40 90 26 94

