Content
Published:
This is an archived release.
Increase in energy prices
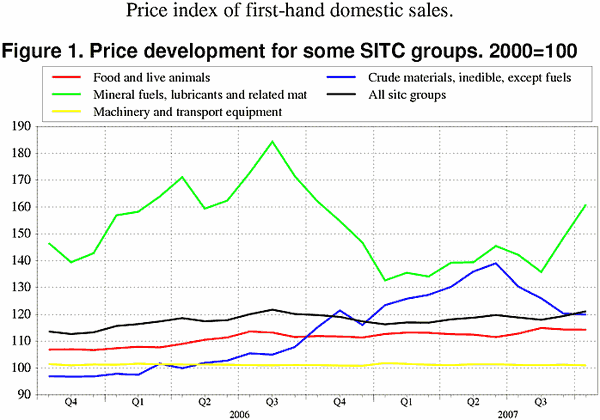
Higher prices of petroleum products and electricity were the main drivers behind the 1.4 increase in the price index of first-hand domestic sales. The increase was partly offset by lower prices of crude materials, chemicals, machinery and transport equipment.
The price index of first-hand domestic sales rose by 1.4 per cent from September to October. Prices of mineral fuels, lubricants and related material rose by 8.3 per cent. The main reason for the development was higher prices of electricity, up 42.1 per cent. Little rain, chilly weather and higher consumption explained the increase. Prices of petroleum products and gas also increased, partly due to the record-low US dollar. Oil-producing countries had to raise the oil price to maintain the purchasing power.
On the whole, prices of food products showed no change this month. Prices of meat, coffee, dairy products, fruit and vegetables went down, but this was partly offset by higher prices of fish, cereal preparations. Crude materials fell by 0.3 per cent, caused by lower prices of metalliferous ores and metal scrap, while prices of paper increased. Prices of machinery and transport equipment also fell, caused by lower prices of machinery, while higher prices of cars counteracted this development.
Prices in the domestic market increased by 3.2 per cent, due to higher prices of energy goods. In contrast to the total index, prices of crude materials, manufactured articles and manufactured goods rose.
Twelve-month rate: Price growth 1.2 per cent
From October 2006 to October 2007, the index of first-hand domestic sales has increased by 1.1 per cent. The increase is mainly due to higher prices in all groups, except electricity (-25.9), data processing machines (-10.4) and manufactured articles (-0.9). Crude materials have risen by 4.2 per cent, caused by higher prices of lumber and wood. Prices of food have increased due to higher prices of vegetables and fruit (13.3), meat (4.0), dairy products (3.2) and cereal preparations (4.1).
New method for cars
A new method for price information for cars was implemented in September 2007. For more information, see About the statistics.
| October 2007 | Changes, per cent | ||||||||||||||||||||||||||||||||||||||
|---|---|---|---|---|---|---|---|---|---|---|---|---|---|---|---|---|---|---|---|---|---|---|---|---|---|---|---|---|---|---|---|---|---|---|---|---|---|---|---|
|
September 2007-
October 2007 |
October 2006-
October 2007 |
||||||||||||||||||||||||||||||||||||||
| Total index | 121.1 | 1.2 | 1.1 | ||||||||||||||||||||||||||||||||||||
| Food and live animals | 114.3 | 0.0 | 2.1 | ||||||||||||||||||||||||||||||||||||
| Beverages and tobacco | 119.3 | -0.2 | 3.4 | ||||||||||||||||||||||||||||||||||||
| Crude materials, inedible, except fuels | 119.9 | -0.3 | 4.2 | ||||||||||||||||||||||||||||||||||||
| Mineral fuels, lubricants and related materials | 160.9 | 8.3 | -0.7 | ||||||||||||||||||||||||||||||||||||
| Chemicals and related products, n.e.s | 110.1 | -0.1 | 0.8 | ||||||||||||||||||||||||||||||||||||
| Manufactured goods classified by material | 115.6 | -0.4 | 3.1 | ||||||||||||||||||||||||||||||||||||
| Machinery and transport equipment | 101.0 | -0.3 | -0.1 | ||||||||||||||||||||||||||||||||||||
| Miscellaneous manufactured articles | 102.9 | -0.6 | -0.9 | ||||||||||||||||||||||||||||||||||||
Additional information
Contact
-
Producer price index
E-mail: produsentpris@ssb.no
tel.: (+47) 21 09 40 00
-
Elisabeth Mælum
E-mail: elisabeth.maelum@ssb.no
tel.: (+47) 97 01 28 49
-
Monika Græsli Engebretsen
E-mail: monika.graesli.engebretsen@ssb.no
tel.: (+47) 40 90 23 71
-
Morten Madshus
E-mail: morten.madshus@ssb.no
tel.: (+47) 40 90 26 94

