Content
Published:
This is an archived release.
Continued decrease in prices
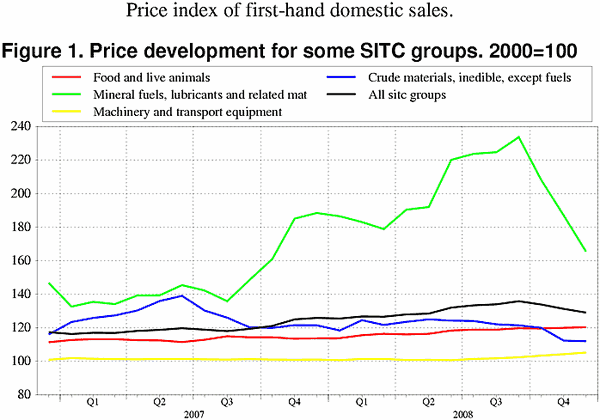
The price index of first-hand domestic sales decreased 1.7 per cent from November to December 2008. The index has experienced a continuous decrease since September, the peak-month in 2008.
The decrease in the price index of first-hand domestic sales persisted from November to December with a third consecutive month of decline. The decrease from November to December is mainly caused by reduced prices on several crude materials and manufactured goods, chemicals and related products and mineral fuels, lubricants and related materials.
The largest contribution to the decline in the overall index came from the group mineral fuels, lubricants and related materials, with an 11.5 per cent decrease. This was in turn due to reduced prices on petroleum and petroleum products and electric current, with 14.5 and 7 per cent lower prices, respectively.
The index for crude materials, inedible, except fuels fell 0.4 per cent from November to December. However, the price movements differed within the group crude materials. Several crude materials experienced large price declines, while the groups wood, lumber and cork and metalliferous ores and metal scrap experienced price increases.
The prices of chemicals and related products and miscellaneous manufactured articles also fell from November to December. For chemicals and related products, which experienced a continued increase in prices from May to October, prices dropped 2.4 per cent. Miscellaneous manufactured articles declined 1.5 per cent at an aggregated level, with the decrease of 10.3 and 3.7 per cent for non-ferrous metals and iron and steal respectively the most important.
The prices included in the price index of first-hand domestic sales are measured in the Norwegian krone. Towards the end of 2008 NOK has experienced a loss in value against important currencies such as the USD and the EUR. In a case where the price of a good remains unchanged in a foreign currency, the price of the good measured in NOK will still increase, because Norwegian importers will have to pay more for buying the good in USD or EUR. This effect could have contributed to increase the growth or reduce the decrease in the prices of imported goods.
Reduced twelve month change
The price index of first-hand domestic sales increased 2.5 per cent from December 2007 to December 2008. This is a lower twelve month growth compared to earlier in 2008. The prices of mineral fuels, lubricants and related materials and crude materials decreased 12.2 and 7.9 per cent from December 2007respectively, both lower than the respective twelve month change in November.
Two groups stand out with a continued increase in the twelve month change; machinery and transport equipment, with a twelve month growth of 4.1 per cent (up from 3.3), and miscellaneous manufactured articles, with a twelve month growth of 6.2 per cent (up from 4.8).
High annual growth
The price index of first-hand domestic sales grew 9 per cent from 2007 to 2008. This is due to a relatively strong increase in the prices until September 2008. The corresponding period of 2007 is characterized by a more modest growth in prices. Towards the end of 2008 the aggregate index dropped somewhat. The relatively strong annual growth is mainly due to strong price growth within the groups mineral fuels, lubricants and related materials up until September and chemical products up until October.
The annual price growth of mineral fuels, lubricants and related materials was 33.9 per cent, and this has been heavily influenced by the prices of petroleum and petroleum products and electric current. The prices of petroleum and petroleum products were in turn influenced of the price development of the crude oil Brent Blend, which increased 36 per cent during the first five months of 2008. The second half of 2008 saw the oil industry experience a large drop in the demand for crude oil. Reduced demand contributed to reducing the price of crude oil, which almost halved from June to November 2008 (Brent Blend). This led to reduced prices of petroleum end petroleum products in this period.
The annual index for the price of electricity is characterized by a high level during the second half of 2008. This has led to an annual growth of 65.3 per cent from 2007 to 2008.
While the prices of chemicals and related products saw only small changes during most of 2007, the prices in this group increased during 2008. The annual growth from 2007 to 2008 ended up at 10.9 per cent.
The price development for crude materials has contributed to moderate the increase in the aggregate index, with a price drop of 4.7 per cent from 2007 to 2008. This drop is due to a high level of the index for crude materials during 2007, and considerably reduced prices towards the end of 2008, particularly in November when the prices dropped 6.3 per cent.
| December 2008 | Changes, per cent | ||||||||||||||||||||||||||||||||||||||
|---|---|---|---|---|---|---|---|---|---|---|---|---|---|---|---|---|---|---|---|---|---|---|---|---|---|---|---|---|---|---|---|---|---|---|---|---|---|---|---|
|
November 2008-
December 2008 |
December 2007-
December 2008 |
||||||||||||||||||||||||||||||||||||||
| Total index | 129.0 | -1.7 | 2.5 | ||||||||||||||||||||||||||||||||||||
| Food and live animals | 120.3 | 0.2 | 5.8 | ||||||||||||||||||||||||||||||||||||
| Beverages and tobacco | 127.8 | 0.2 | 7.2 | ||||||||||||||||||||||||||||||||||||
| Crude materials, inedible, except fuels | 111.9 | -0.4 | -7.9 | ||||||||||||||||||||||||||||||||||||
| Mineral fuels, lubricants and related materials | 165.5 | -11.5 | -12.2 | ||||||||||||||||||||||||||||||||||||
| Chemicals and related products, n.e.s | 130.7 | -2.4 | 17.3 | ||||||||||||||||||||||||||||||||||||
| Manufactured goods classified by material | 123.7 | -1.5 | 5.9 | ||||||||||||||||||||||||||||||||||||
| Machinery and transport equipment | 105.3 | 0.9 | 4.1 | ||||||||||||||||||||||||||||||||||||
| Miscellaneous manufactured articles | 108.8 | 1.5 | 6.2 | ||||||||||||||||||||||||||||||||||||
Additional information
Contact
-
Producer price index
E-mail: produsentpris@ssb.no
tel.: (+47) 21 09 40 00
-
Elisabeth Mælum
E-mail: elisabeth.maelum@ssb.no
tel.: (+47) 97 01 28 49
-
Monika Græsli Engebretsen
E-mail: monika.graesli.engebretsen@ssb.no
tel.: (+47) 40 90 23 71
-
Morten Madshus
E-mail: morten.madshus@ssb.no
tel.: (+47) 40 90 26 94

