Content
Published:
This is an archived release.
Decrease in electricity prices
Despite lower prices on electricity, the price index of first-hand domestic sales remained unchanged from December 2008 to January 2009. From January 2008 to January 2009 the total index increased by 2.8 per cent.
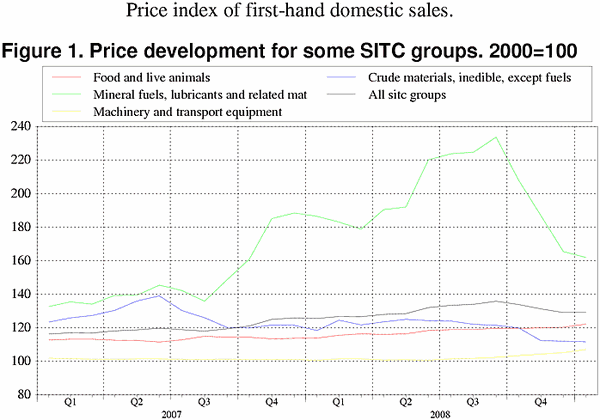
Prices of mineral fuels, lubricants and related materials decreased by 2.2 per cent from December to January. The largest contribution to the decline came from a fall in electricity prices of 8.5 per cent. Prices of chemicals and related products fell by 4.1 per cent last month, mainly due to a relatively sharp fall in prices of organic chemicals.
Both food products and machinery and transport equipment increased in price from December to January, with 1.6 and 1.7 per cent respectively. With the exception of animal and vegetable oils, fats and waxes, the other groups had only moderate changes.
As to crude materials, inedible, except fuels, the price of pulp and waste paper has been strongly reduced over the last month. The price reduction of paper can be a consequence of fewer ads in newspapers because of the financial crisis and thereby lower demand for this kind of commodity.
Twelve month change: Price rise of 2.8 per cent.
The twelve month growth in the price index of first-hand domestic sales for January 2009 was 2.8 per cent, up from 2.5 per cent in December.
The increase in the overall index in mainly due to higher prices in all groups, except for a reduction in the twelve month change for crude material, inedible, except fuels, mineral fuels, lubricants and related material and for animal and vegetable oils, fats and waxes.
Prices of mineral fuels, lubricants and related material fell by 13.2 per cent from January 2008 to January 2009, due to a strong decrease in the prices of petroleum products.
| January 2009 | Changes, per cent | ||||||||||||||||||||||||||||||||||||||
|---|---|---|---|---|---|---|---|---|---|---|---|---|---|---|---|---|---|---|---|---|---|---|---|---|---|---|---|---|---|---|---|---|---|---|---|---|---|---|---|
|
December 2008-
January 2009 |
January 2008-
January 2009 |
||||||||||||||||||||||||||||||||||||||
| Total index | 129.0 | 0.0 | 2.8 | ||||||||||||||||||||||||||||||||||||
| Food and live animals | 122.2 | 1.6 | 7.4 | ||||||||||||||||||||||||||||||||||||
| Beverages and tobacco | 131.5 | 2.9 | 8.5 | ||||||||||||||||||||||||||||||||||||
| Crude materials, inedible, except fuels | 111.7 | -0.3 | -5.7 | ||||||||||||||||||||||||||||||||||||
| Mineral fuels, lubricants and related materials | 161.9 | -2.2 | -13.2 | ||||||||||||||||||||||||||||||||||||
| Chemicals and related products, n.e.s | 125.4 | -4.1 | 10.8 | ||||||||||||||||||||||||||||||||||||
| Manufactured goods classified by material | 124.1 | 0.3 | 5.8 | ||||||||||||||||||||||||||||||||||||
| Machinery and transport equipment | 107.1 | 1.7 | 6.4 | ||||||||||||||||||||||||||||||||||||
| Miscellaneous manufactured articles | 109.8 | 0.9 | 7.5 | ||||||||||||||||||||||||||||||||||||
New weightsEntering a new year, the weights used for calculating the price index have been updated. The weights express the influence of different goods on the total price index, and are based on the shares of different industries in the total production value in the Norwegian economy in the previous year. The largest changes from 2008 to 2009 was increased the weights for fuels, lubricants and related materials and for electricity. The corresponding decline in weights for other goods was the highest for inedible crude materials except fuels. |
Additional information
Contact
-
Producer price index
E-mail: produsentpris@ssb.no
tel.: (+47) 21 09 40 00
-
Elisabeth Mælum
E-mail: elisabeth.maelum@ssb.no
tel.: (+47) 97 01 28 49
-
Monika Græsli Engebretsen
E-mail: monika.graesli.engebretsen@ssb.no
tel.: (+47) 40 90 23 71
-
Morten Madshus
E-mail: morten.madshus@ssb.no
tel.: (+47) 40 90 26 94

