Content
Published:
This is an archived release.
Higher prices in energy products
The price index of first-hand domestic sales (PIF) rose by 0.7 per cent from December 2009 to January 2010, mainly due to higher prices in energy products, and higher electricity prices in particular.
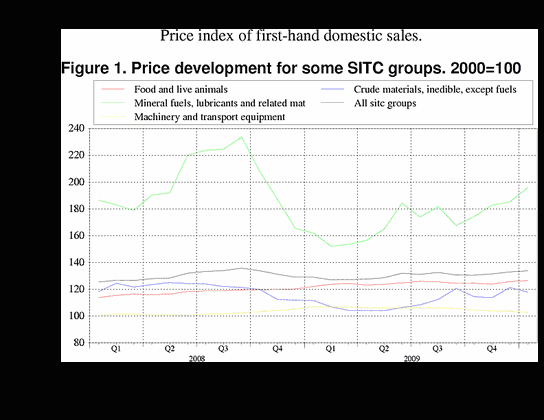
The price index of first-hand domestic sales (PIF) increased by 0.7 per cent from December 2009 to January 2010. The rise was mainly caused by higher prices within mineral fuels, lubricants and related materials, where prices increased by 5.9 per cent. In particular, electricity prices rose 14 per cent this period, but higher prices of petroleum and petroleum products also contributed to the rise from December 2009 to January 2010.
Prices of food products rose by 0.7 per cent mainly due to higher prices of vegetables and fruit, and increasing prices of cereals and cereal preparations.
The rise in PIF was lowered by falling prices of machinery and transport equipment, lower prices of crude materials, inedible, except fuels, as well as decreasing prices of chemicals and related products. Within the group chemicals as well as machinery and transport equipment, prices dropped in almost all sub-groups.
Higher twelve-month change
PIF increased by 3.8 per cent from January 2009 to January 2010. Prices of mineral fuels, lubricants and related materials rose by 21.1 per cent, which was the main reason behind the rise in the overall index. The strongest contribution within this group came from higher prices of petroleum and petroleum products.
Prices of food products increased by 3.6 per cent from January 2009 to January 2010, and prices of crude materials, inedible, except fuels rose by 5.6 per cent in the same period. On the other hand, a 3.9 per cent fall in prices of machinery and transport equipment lowered the increase in the overall index.
New weightsEntering a new year, the weights used for calculating the price index have been updated. The weights express the influence of different goods on the total price index, and are based on the shares of different industries in the total production value in the Norwegian economy in the previous year. Compared with 2009, food and live animals have a larger impact in the index in 2010, while crude materials, mineral fuels and metals have smaller weights. |
New measurement of electricity pricesFrom January 2010 a new method is used for measuring electricity prices in the price index of first hand domestic sales (PIF). The purpose of the new method is to improve the measurement of the price developments for various types of power contracts in the PIF. Thus, the new method involves divisions into a higher number of representative products and an extended use of data compared to the old method. Data from other surveys in Statistics Norway are used as well as Nordpool. |
| January 2010 | Changes, per cent | ||||||||||||||||||||||||||||||||||||||||||||||||||||||||||||||||||||||||||||||
|---|---|---|---|---|---|---|---|---|---|---|---|---|---|---|---|---|---|---|---|---|---|---|---|---|---|---|---|---|---|---|---|---|---|---|---|---|---|---|---|---|---|---|---|---|---|---|---|---|---|---|---|---|---|---|---|---|---|---|---|---|---|---|---|---|---|---|---|---|---|---|---|---|---|---|---|---|---|---|---|
|
December 2009-
January 2010 |
January 2009-
January 2010 |
||||||||||||||||||||||||||||||||||||||||||||||||||||||||||||||||||||||||||||||
| Total index | 133.9 | 0.7 | 3.8 | ||||||||||||||||||||||||||||||||||||||||||||||||||||||||||||||||||||||||||||
| Food and live animals | 126.6 | 0.7 | 3.6 | ||||||||||||||||||||||||||||||||||||||||||||||||||||||||||||||||||||||||||||
| Beverages and tobacco | 137.2 | 0.4 | 4.3 | ||||||||||||||||||||||||||||||||||||||||||||||||||||||||||||||||||||||||||||
| Crude materials, inedible, except fuels | 117.9 | -2.8 | 5.6 | ||||||||||||||||||||||||||||||||||||||||||||||||||||||||||||||||||||||||||||
| Mineral fuels, lubricants and related materials | 196.1 | 5.9 | 21.1 | ||||||||||||||||||||||||||||||||||||||||||||||||||||||||||||||||||||||||||||
| Chemicals and related products, n.e.s | 125.5 | -1.3 | 0.1 | ||||||||||||||||||||||||||||||||||||||||||||||||||||||||||||||||||||||||||||
| Manufactured goods classified by material | 124.6 | 0.2 | 0.4 | ||||||||||||||||||||||||||||||||||||||||||||||||||||||||||||||||||||||||||||
| Machinery and transport equipment | 102.8 | -0.8 | -3.9 | ||||||||||||||||||||||||||||||||||||||||||||||||||||||||||||||||||||||||||||
| Miscellaneous manufactured articles | 108.5 | -0.1 | -1.2 | ||||||||||||||||||||||||||||||||||||||||||||||||||||||||||||||||||||||||||||
Additional information
Contact
-
Producer price index
E-mail: produsentpris@ssb.no
tel.: (+47) 21 09 40 00
-
Elisabeth Mælum
E-mail: elisabeth.maelum@ssb.no
tel.: (+47) 97 01 28 49
-
Monika Græsli Engebretsen
E-mail: monika.graesli.engebretsen@ssb.no
tel.: (+47) 40 90 23 71
-
Morten Madshus
E-mail: morten.madshus@ssb.no
tel.: (+47) 40 90 26 94

