Content
Published:
This is an archived release.
Higher prices of food and chemicals
The price index of first-hand domestic sales (PIF) rose by 0.7 per cent from January to February. Food and chemicals played a particularly large role in the rise in PIF.
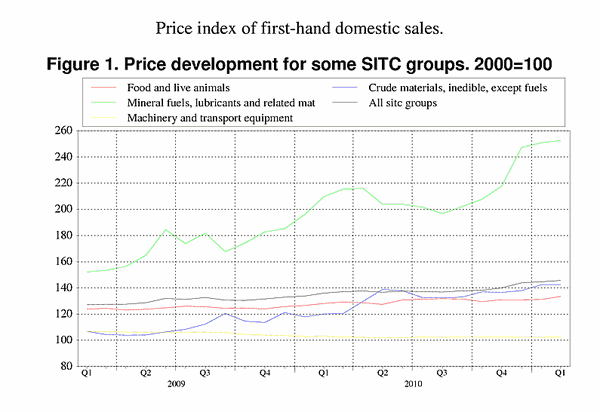
From January to February, most commodity groups experienced a rise in prices, but food and live animals together with chemicals and related products were most important to the overall price growth, with 1.9 and 1.8 per cent higher prices respectively. Food was characterised by a wide increase in prices, with prices for all the food groups exceeding those of January 2011 as well as February 2010. Prices of fish and fish products, vegetables and fruit, together with coffee, tea, cocoa and spices increased by 3.1, 4 and 4.3 per cent respectively.
Increased prices of chemicals
Prices of chemicals and related products have risen since October 2010, with the exception of a small decline from December 2010 to January 2011. From January to February, prices increased in all groups of chemicals, except medicinal and pharmaceutical products, which experienced a 0.9 per cent decrease in prices. Higher prices of inorganic and organic chemicals as well as plastics in primary forms played a large role in the overall price growth for chemicals.
Prices of mineral fuels, lubricants and related materials increased by 0.6 per cent from January to February. Petroleum and petroleum products increased, while lower prices of natural gas and electricity reduced the overall price growth for this commodity group. The price index for mineral fuels, lubricants and related materials has experienced a continuous growth since August last year. Much of the increase up until December last year was caused by higher prices of electricity as well as petroleum and petroleum products, while rising prices of petroleum and petroleum products have played a large role in the increase in 2011.
Twelve-month change: higher prices of oil and metals
The twelve-month change in PIF from February 2010 to February 2011 was 7.1 per cent, down from 8.1 per cent in January. In this twelve-month period prices increased in most commodity groups. Two exceptions were machinery and transport equipment together with beverages and tobacco, in which prices fell by 0.2 and 1.3 per cent. Mineral fuels, lubricants and related materials as well as crude materials were the most important reason for the growth in PIF over the last twelve months, with 20.4 and 18.7 per cent higher prices respectively. Petroleum and petroleum products have experienced a rise in prices of 33.5 per cent in this twelve-month period. In addition, prices of iron and steel as well as non-ferrous metals rose sharply over the last twelve months, up 15.6 and 20.5 per cent.
After high twelve-month growth rates in the prices of electricity over some time, the index is back at approximately the same level as February 2010. This is due to the 5.6 decrease from January to February this year, and the sharp rise in electricity prices from January to February last year.
| February 2011 | Changes, per cent | ||||||||||||||||||||||||||||||||||||||||||||||||||||||||||||||||||||||||||||||
|---|---|---|---|---|---|---|---|---|---|---|---|---|---|---|---|---|---|---|---|---|---|---|---|---|---|---|---|---|---|---|---|---|---|---|---|---|---|---|---|---|---|---|---|---|---|---|---|---|---|---|---|---|---|---|---|---|---|---|---|---|---|---|---|---|---|---|---|---|---|---|---|---|---|---|---|---|---|---|---|
| January 2011-February 2011 | February 2010-February 2011 | ||||||||||||||||||||||||||||||||||||||||||||||||||||||||||||||||||||||||||||||
| Total index | 145.7 | 0.7 | 7.1 | ||||||||||||||||||||||||||||||||||||||||||||||||||||||||||||||||||||||||||||
| Food and live animals | 133.6 | 1.9 | 4.2 | ||||||||||||||||||||||||||||||||||||||||||||||||||||||||||||||||||||||||||||
| Beverages and tobacco | 135.4 | 0.7 | -1.3 | ||||||||||||||||||||||||||||||||||||||||||||||||||||||||||||||||||||||||||||
| Crude materials, inedible, except fuels | 142.6 | 0.1 | 18.7 | ||||||||||||||||||||||||||||||||||||||||||||||||||||||||||||||||||||||||||||
| Mineral fuels, lubricants and related materials | 252.5 | 0.6 | 20.4 | ||||||||||||||||||||||||||||||||||||||||||||||||||||||||||||||||||||||||||||
| Chemicals and related products, n.e.s | 134.9 | 1.8 | 7.1 | ||||||||||||||||||||||||||||||||||||||||||||||||||||||||||||||||||||||||||||
| Manufactured goods classified by material | 131.1 | -0.1 | 5.2 | ||||||||||||||||||||||||||||||||||||||||||||||||||||||||||||||||||||||||||||
| Machinery and transport equipment | 102.7 | 0.5 | -0.2 | ||||||||||||||||||||||||||||||||||||||||||||||||||||||||||||||||||||||||||||
| Miscellaneous manufactured articles | 109.4 | 0.2 | 0.6 | ||||||||||||||||||||||||||||||||||||||||||||||||||||||||||||||||||||||||||||
Additional information
Contact
-
Producer price index
E-mail: produsentpris@ssb.no
tel.: (+47) 21 09 40 00
-
Elisabeth Mælum
E-mail: elisabeth.maelum@ssb.no
tel.: (+47) 97 01 28 49
-
Monika Græsli Engebretsen
E-mail: monika.graesli.engebretsen@ssb.no
tel.: (+47) 40 90 23 71
-
Morten Madshus
E-mail: morten.madshus@ssb.no
tel.: (+47) 40 90 26 94

