Content
Published:
This is an archived release.
Price increase in oil products
Prices of petroleum and petroleum products increased by 6.4 per cent from February to March, and played the largest role in bringing the price index of first-hand domestic sales (PIF) up by 0.9 per cent.
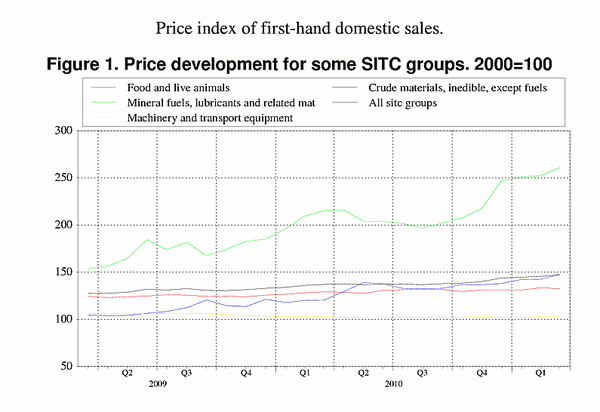
From February to March, prices of mineral fuels, lubricants and related materials increased by 3.4 per cent. Much of the increase was caused by rising prices of petroleum and petroleum products, which in turn is related to the 7.3 per cent rise in crude oil (Brent Blend measured in NOK). Prices of petroleum and petroleum products have experienced a continuous increase since August 2010, with a total price rise of 31.5 per cent. PIF increased by 7.4 per cent in the same period.
2.4 per cent lower prices of electricity reduced the overall price growth. Both electricity sold to households and the spot price (measured by the system price at Nord Pool Spot) fell from February to March.
Increased prices in manufactured goods and chemicals
From February to March, prices of manufactured goods as well as chemicals and related materials increased by 1.1 and 0.4 per cent respectively. In particular, manufactured goods such as non-metallic mineral manufactures, paper and paper products, together with iron and steel experienced rising prices. The price growth in chemicals and related products came from the domestic market, in which prices rose 2.9 per cent. Prices of chemicals also increased from January to February, but the increase in that period was caused by higher prices in both the domestic and import markets.
From February to March, prices of inedible crude materials, except fuels, grew by 3.8 per cent, and this increase was mainly due to higher prices for metalliferous ores and metal scrap. Most other groups of crude materials experienced a decline in prices from February to March.
Twelve-month rate almost unchanged
The twelve-month rate in PIF was 7.2 per cent from March 2010 to March 2011; about the same as in February. Higher prices of petroleum and petroleum products, metalliferous ores and metal scrap as well as iron and steel played important roles in the increase in PIF in this twelve-month period.
The twelve-month rate for food prices was 2.5 per cent from March 2010 to March 2011; down from 4.2 per cent in February. The twelve-month rates are still high for food groups like animal feeding stuff as well as coffee, tea, cocoa and spices. Lower prices of vegetables and fruit, together with meat and meat preparation reduced the overall price growth of food in this twelve-month period.
| March 2011 | Changes, per cent | ||||||||||||||||||||||||||||||||||||||||||||||||||||||||||||||||||||||||||||||
|---|---|---|---|---|---|---|---|---|---|---|---|---|---|---|---|---|---|---|---|---|---|---|---|---|---|---|---|---|---|---|---|---|---|---|---|---|---|---|---|---|---|---|---|---|---|---|---|---|---|---|---|---|---|---|---|---|---|---|---|---|---|---|---|---|---|---|---|---|---|---|---|---|---|---|---|---|---|---|---|
|
February 2011-
March 2011 |
March 2010-
March 2011 |
||||||||||||||||||||||||||||||||||||||||||||||||||||||||||||||||||||||||||||||
| Total index | 147.0 | 0.9 | 7.2 | ||||||||||||||||||||||||||||||||||||||||||||||||||||||||||||||||||||||||||||
| Food and live animals | 132.4 | -0.9 | 2.5 | ||||||||||||||||||||||||||||||||||||||||||||||||||||||||||||||||||||||||||||
| Beverages and tobacco | 135.8 | 0.3 | -1.4 | ||||||||||||||||||||||||||||||||||||||||||||||||||||||||||||||||||||||||||||
| Crude materials, inedible, except fuels | 148.0 | 3.8 | 23.0 | ||||||||||||||||||||||||||||||||||||||||||||||||||||||||||||||||||||||||||||
| Mineral fuels, lubricants and related materials | 261.2 | 3.4 | 21.3 | ||||||||||||||||||||||||||||||||||||||||||||||||||||||||||||||||||||||||||||
| Chemicals and related products, n.e.s | 135.4 | 0.4 | 6.0 | ||||||||||||||||||||||||||||||||||||||||||||||||||||||||||||||||||||||||||||
| Manufactured goods classified by material | 132.6 | 1.1 | 6.1 | ||||||||||||||||||||||||||||||||||||||||||||||||||||||||||||||||||||||||||||
| Machinery and transport equipment | 102.5 | -0.2 | -0.1 | ||||||||||||||||||||||||||||||||||||||||||||||||||||||||||||||||||||||||||||
| Miscellaneous manufactured articles | 109.6 | 0.2 | 1.1 | ||||||||||||||||||||||||||||||||||||||||||||||||||||||||||||||||||||||||||||
Additional information
Contact
-
Producer price index
E-mail: produsentpris@ssb.no
tel.: (+47) 21 09 40 00
-
Elisabeth Mælum
E-mail: elisabeth.maelum@ssb.no
tel.: (+47) 97 01 28 49
-
Monika Græsli Engebretsen
E-mail: monika.graesli.engebretsen@ssb.no
tel.: (+47) 40 90 23 71
-
Morten Madshus
E-mail: morten.madshus@ssb.no
tel.: (+47) 40 90 26 94

