Content
Published:
This is an archived release.
Price decreases in crude materials and electricity
The price index of first-hand domestic sales (PIF) decreased by 0.3 per cent from March to April. Prices in several groups of crude materials, as well as electricity prices played the largest role in bringing the total down.
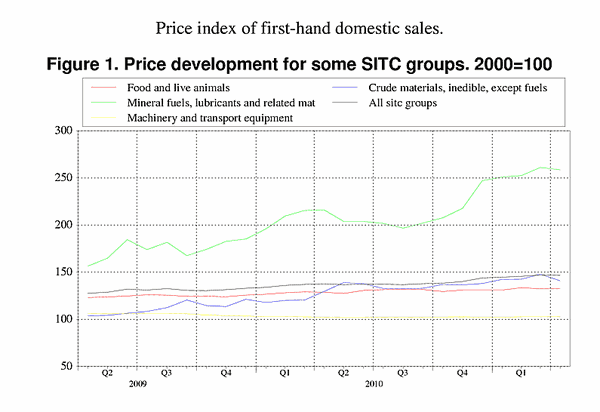
Crude materials, inedible, except fuels, which fell by 4.8 per cent, made the largest contribution to the price fall in PIF from March to April. The total index was affected the most by wood, lumber and cork as well as metalliferous ores and metal scrap. Metalliferous ores and metal scrap fell by as much as 11.1 per cent from March to April due to lower prices of nickel and aluminium ores, while prices in wood, lumber and cork decreased by 0.5 per cent in the same period due to lower prices in Norwegian lumber.
Electricity prices fell by 13.9 per cent from March to April. Lower power consumption as a result of warmer weather, as well as increased levels in Norwegian water reservoirs and higher electricity production are some of the reasons for lower electricity prices.
Prices in petroleum and petroleum products increased further in April. Prices of crude oil (Brent Blend) have been rising since September 2010, due to higher fuel demand and insecurity about oil production and deliveries caused by unrest in the Middle-East.
Increased prices in food and chemicals
From March to April, prices of food and chemical products increased by 0.3 and 1.2 per cent respectively. The price growth in food came from the domestic market, and was mainly caused by price rises in Norwegian meat and meat products, fish and fish products, as well as vegetables and fruits. With regard to prices of chemicals, the price increases in that period were caused by higher prices in both the domestic and import markets.
Twelve-month change: 6.5 per cent higher prices
PIF increased by 6.5 per cent from April 2010 to April 2011. The main contribution to the twelve-month growth came from mineral fuels, lubricants and related materials, and particularly petroleum and petroleum products, which increased by 31.0 per cent. Electricity prices, however, decreased by 4.0 per cent from April 2010 to April 2011, mainly due to warmer weather in April 2011 and lower electricity consumption, as well as a higher reservoir inflow.
Manufactured goods of iron and steel as well as paper and paper products also affected PIF in this twelve-month period. Prices in these groups were relatively low in 2010, and increased by 13.2 and 7.8 per cent respectively from April 2010 to April 2011.
Chemicals and related materials have experienced price increases in this period as well, and rose by 8.0 per cent from April 2010 to April 2011.Food prices increased by 3.2 per cent in the same period, mainly due to the increase in Norwegian meat, fish and vegetables and fruits.
| April 2011 | Changes, per cent | ||||||||||||||||||||||||||||||||||||||||||||||||||||||||||||||||||||||||||||||
|---|---|---|---|---|---|---|---|---|---|---|---|---|---|---|---|---|---|---|---|---|---|---|---|---|---|---|---|---|---|---|---|---|---|---|---|---|---|---|---|---|---|---|---|---|---|---|---|---|---|---|---|---|---|---|---|---|---|---|---|---|---|---|---|---|---|---|---|---|---|---|---|---|---|---|---|---|---|---|---|
|
March 2011-
April 2011 |
April 2010-
April 2011 |
||||||||||||||||||||||||||||||||||||||||||||||||||||||||||||||||||||||||||||||
| Total index | 146.6 | -0.3 | 6.5 | ||||||||||||||||||||||||||||||||||||||||||||||||||||||||||||||||||||||||||||
| Food and live animals | 132.8 | 0.3 | 3.2 | ||||||||||||||||||||||||||||||||||||||||||||||||||||||||||||||||||||||||||||
| Beverages and tobacco | 135.8 | 0.0 | -1.9 | ||||||||||||||||||||||||||||||||||||||||||||||||||||||||||||||||||||||||||||
| Crude materials, inedible, except fuels | 140.9 | -4.8 | 8.7 | ||||||||||||||||||||||||||||||||||||||||||||||||||||||||||||||||||||||||||||
| Mineral fuels, lubricants and related materials | 258.6 | -1.0 | 19.7 | ||||||||||||||||||||||||||||||||||||||||||||||||||||||||||||||||||||||||||||
| Chemicals and related products, n.e.s | 137.0 | 1.2 | 8.0 | ||||||||||||||||||||||||||||||||||||||||||||||||||||||||||||||||||||||||||||
| Manufactured goods classified by material | 132.8 | 0.2 | 5.3 | ||||||||||||||||||||||||||||||||||||||||||||||||||||||||||||||||||||||||||||
| Machinery and transport equipment | 102.9 | 0.4 | 0.7 | ||||||||||||||||||||||||||||||||||||||||||||||||||||||||||||||||||||||||||||
| Miscellaneous manufactured articles | 109.6 | 0.0 | 1.0 | ||||||||||||||||||||||||||||||||||||||||||||||||||||||||||||||||||||||||||||
Additional information
Contact
-
Producer price index
E-mail: produsentpris@ssb.no
tel.: (+47) 21 09 40 00
-
Elisabeth Mælum
E-mail: elisabeth.maelum@ssb.no
tel.: (+47) 97 01 28 49
-
Monika Græsli Engebretsen
E-mail: monika.graesli.engebretsen@ssb.no
tel.: (+47) 40 90 23 71
-
Morten Madshus
E-mail: morten.madshus@ssb.no
tel.: (+47) 40 90 26 94

