Content
Published:
This is an archived release.
Prices increase for most goods
Despite increased prices for most groups of goods the price index for first-hand domestic sales (PIF) fell by 0.1 per cent from April to May. The decrease was caused by lower prices of petroleum, petroleum products and electricity.
The price index for first-hand domestic sales (PIF) measures the development in prices of goods produced in Norway that are sold to domestic customers and of imported goods.
Lower prices of petroleum and electricity
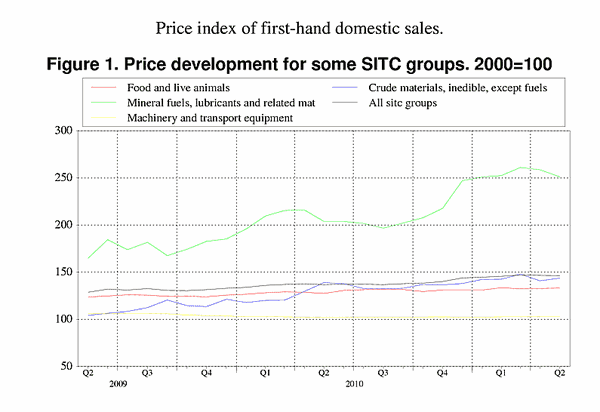
The index fell for the second consecutive month, as 2.9 per cent lower prices of petroleum, petroleum products and electricity led to a 0.1 per cent drop in the overall index. The price of electricity has fallen since December 2010 and decreased further by 0.3 per cent from April to May, which is a relatively modest change compared with the previous months. Prices for petroleum and petroleum products fell by 4.2 per cent, following eight months of growing prices since August.
Increased prices for other goods
For the other main groups of goods in the index, prices increased or were unchanged from April to May. The groups with the largest changes were chemicals and related products and inedible crude materials except fuels, which both had growth rates of 2.1 per cent. The increase in crude materials was mainly caused by higher prices for metalliferous ores and metal scrap; a group of goods that often sees large changes in prices from month to month.
Among chemicals and related products, the price increases were mainly found in organic and inorganic chemicals, i.e. less manufactured products, which rose by 5.7 and 4.9 per cent respectively. The more manufactured products, such as pharmaceutical products, fertilisers, essential oils and resinoids had minor price increases from April to May.
Twelve month change: 7.1 per cent higher prices
PIF was 7.1 per cent higher in May this year than in May of last year. Prices rose for all main groups of goods, except beverages and tobacco. The index for the domestic market, i.e. goods produced in Norway and sold to domestic customers, increased by 10.4 per cent. This means that the price growth for domestically produced goods was stronger than for imported ones.
For the overall index, consisting of both domestic and imported goods, the highest price increases were found in petroleum, petroleum products and electricity and chemicals and related products, where prices were 23.2 and 9.7 per cent higher respectively than in May 2010.
Varying price changes for machinery and transport equipment
The index for machinery and transport equipment shows a price growth of 0.9 per cent from May last year to May this year. As a whole, the group has had relatively stable prices in 2010 and 2011, following a sharp jump in the second half of 2008, and an almost corresponding fall in 2009. Within the group there are different developments in the prices of different goods. Prices of office machines and data processing machines fell by 7.3 per cent from May last year to May 2011, while electrical machinery and apparatus and road vehicles saw price increases of 5.4 and 2.9 per cent respectively over the same period.
| May 2011 | Changes, per cent | ||||||||||||||||||||||||||||||||||||||||||||||||||||||||||||||||||||||||||||||
|---|---|---|---|---|---|---|---|---|---|---|---|---|---|---|---|---|---|---|---|---|---|---|---|---|---|---|---|---|---|---|---|---|---|---|---|---|---|---|---|---|---|---|---|---|---|---|---|---|---|---|---|---|---|---|---|---|---|---|---|---|---|---|---|---|---|---|---|---|---|---|---|---|---|---|---|---|---|---|---|
| April 2011-May 2011 | May 2010-May 2011 | ||||||||||||||||||||||||||||||||||||||||||||||||||||||||||||||||||||||||||||||
| Total index | 146.4 | -0.1 | 7.1 | ||||||||||||||||||||||||||||||||||||||||||||||||||||||||||||||||||||||||||||
| Food and live animals | 133.1 | 0.2 | 4.4 | ||||||||||||||||||||||||||||||||||||||||||||||||||||||||||||||||||||||||||||
| Beverages and tobacco | 136.3 | 0.4 | -1.0 | ||||||||||||||||||||||||||||||||||||||||||||||||||||||||||||||||||||||||||||
| Crude materials, inedible, except fuels | 143.8 | 2.1 | 3.5 | ||||||||||||||||||||||||||||||||||||||||||||||||||||||||||||||||||||||||||||
| Mineral fuels, lubricants and related materials | 251.2 | -2.9 | 23.2 | ||||||||||||||||||||||||||||||||||||||||||||||||||||||||||||||||||||||||||||
| Chemicals and related products, n.e.s | 139.9 | 2.1 | 9.7 | ||||||||||||||||||||||||||||||||||||||||||||||||||||||||||||||||||||||||||||
| Manufactured goods classified by material | 133.0 | 0.2 | 5.0 | ||||||||||||||||||||||||||||||||||||||||||||||||||||||||||||||||||||||||||||
| Machinery and transport equipment | 102.9 | 0.0 | 0.9 | ||||||||||||||||||||||||||||||||||||||||||||||||||||||||||||||||||||||||||||
| Miscellaneous manufactured articles | 109.8 | 0.2 | 1.4 | ||||||||||||||||||||||||||||||||||||||||||||||||||||||||||||||||||||||||||||
Additional information
Contact
-
Producer price index
E-mail: produsentpris@ssb.no
tel.: (+47) 21 09 40 00
-
Elisabeth Mælum
E-mail: elisabeth.maelum@ssb.no
tel.: (+47) 97 01 28 49
-
Monika Græsli Engebretsen
E-mail: monika.graesli.engebretsen@ssb.no
tel.: (+47) 40 90 23 71
-
Morten Madshus
E-mail: morten.madshus@ssb.no
tel.: (+47) 40 90 26 94

