Content
Published:
This is an archived release.
Decrease in PIF
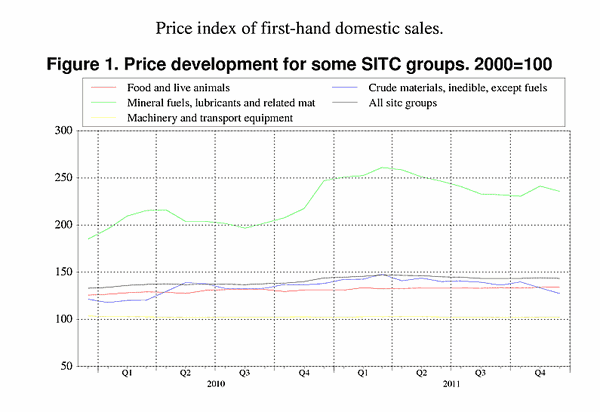
Price index of first-hand domestic sales (PIF) decreased 0.6 per cent from November to December 2011. The main reasons were lower prices in mineral fuels, lubricants and related materials as well as inedible crude materials.
Price index of first-hand domestic sales decreased 0.6 per cent from November to December 2011. Both import prices and prices on the domestic market fell. The main reasons behind the overall price decrease on the domestic market were lower prices of electricity and of petroleum and petroleum products. As for the import market, lower prices of metalliferous ores and metal scrap were important contributors, but the decline in electricity prices and petroleum products was also an important factor behind the overall decline in import prices.
Twelve month change: slightly lower prices
PIF decreased 0.4 per cent from December 2010 to December 2011. A fall in prices of electricity and lower metal prices was an important reason behind the decline. Electricity prices fell more that 43 per cent and prices of metalliferous ores and metal scrap were almost 20 per cent lower in December 2011 compared to December 2010. Non-ferrous metals saw their prices fall close to 15 per cent in the same period and the prices of iron and steel also declined.
2010 vs 2011: Prices in 2011 were higher on average
The annual growth in PIF from 2010 to 2011 was 5.1 per cent, somewhat lower than that from 2009 to 2010. Prices of mineral fuels, lubricants and related materials were 16.5 per cent higher in 2011 than in 2010. This was primarily due to a price growth of 28 per cent on petroleum and petroleum products. This price jump was partly offset by a drop in the electricity prices, where prices were 8.1 per cent lower in 2011 compared to 2010. This price drop must be seen together with the sharp growth in electricity prices in autumn 2010, due to low reservoir levels and cold weather. The peak in December 2010 was followed by a decrease in electricity prices through 2011, with the exception of the price increase from October to November. Parts of 2011 were characterised by heavy precipitation, which led to a sharp recovery of the reservoir levels. The large inflow of water and risk of overflow in many reservoirs may have led to increased production, and in turn, lower prices.
Chemical products had an annual growth of 6.2 per cent from 2010 to 2011. Organic and inorganic chemicals as well as plastics in primary forms had the strongest price growth within this commodity group. The annual growth in prices of chemical products was dampened by the price development of medicinal and pharmaceutical products, where prices were 7.3 per cent lower in 2011 than 2010.
From 2010 to 2011 food prices rose a moderate 2.6 per cent. Dairy products and birds’ eggs, cereals and cereal preparations as well as feeding stuff for animals were the subgroups that were most important in explaining the price increase of food products.
Prices of crude materials (inedible, except fuels) increased 6.4 per cent from 2010 to 2011. The price growth from 2009 to 2010 was 18.5 per cent for this commodity group. The main reason for the decline in the annual growth was lower growth in prices of metalliferous ores and metal scrap.
| December 2011 | Changes, per cent | ||||||||||||||||||||||||||||||||||||||||||||||||||||||||||||||||||||||||||||||
|---|---|---|---|---|---|---|---|---|---|---|---|---|---|---|---|---|---|---|---|---|---|---|---|---|---|---|---|---|---|---|---|---|---|---|---|---|---|---|---|---|---|---|---|---|---|---|---|---|---|---|---|---|---|---|---|---|---|---|---|---|---|---|---|---|---|---|---|---|---|---|---|---|---|---|---|---|---|---|---|
| November 2011-December 2011 | December 2010-December 2011 | ||||||||||||||||||||||||||||||||||||||||||||||||||||||||||||||||||||||||||||||
| Total index | 143.3 | -0.6 | -0.4 | ||||||||||||||||||||||||||||||||||||||||||||||||||||||||||||||||||||||||||||
| Food and live animals | 133.9 | - | 2.2 | ||||||||||||||||||||||||||||||||||||||||||||||||||||||||||||||||||||||||||||
| Beverages and tobacco | 138.9 | 0.1 | 2.6 | ||||||||||||||||||||||||||||||||||||||||||||||||||||||||||||||||||||||||||||
| Crude materials, inedible, except fuels | 127.5 | -4.5 | -7.5 | ||||||||||||||||||||||||||||||||||||||||||||||||||||||||||||||||||||||||||||
| Mineral fuels, lubricants and related materials | 235.7 | -2.3 | -4.6 | ||||||||||||||||||||||||||||||||||||||||||||||||||||||||||||||||||||||||||||
| Chemicals and related products, n.e.s | 137.8 | -0.1 | 3.8 | ||||||||||||||||||||||||||||||||||||||||||||||||||||||||||||||||||||||||||||
| Manufactured goods classified by material | 130.7 | -0.2 | -0.2 | ||||||||||||||||||||||||||||||||||||||||||||||||||||||||||||||||||||||||||||
| Machinery and transport equipment | 102.4 | 0.2 | 0.1 | ||||||||||||||||||||||||||||||||||||||||||||||||||||||||||||||||||||||||||||
| Miscellaneous manufactured articles | 111.4 | 0.9 | 1.8 | ||||||||||||||||||||||||||||||||||||||||||||||||||||||||||||||||||||||||||||
Additional information
Contact
-
Producer price index
E-mail: produsentpris@ssb.no
tel.: (+47) 21 09 40 00
-
Elisabeth Mælum
E-mail: elisabeth.maelum@ssb.no
tel.: (+47) 97 01 28 49
-
Monika Græsli Engebretsen
E-mail: monika.graesli.engebretsen@ssb.no
tel.: (+47) 40 90 23 71
-
Morten Madshus
E-mail: morten.madshus@ssb.no
tel.: (+47) 40 90 26 94

