Content
Published:
This is an archived release.
Lower prices of crude materials and fuels
The price index of first-hand domestic sales (PIF) was unchanged from September to October. Among the groups with falling prices were inedible crude materials and mineral fuels.
| Per cent | Per cent | Index | Weights1 | |
|---|---|---|---|---|
| October 2013 / September 2013 | October 2013 / October 2012 | October 2013 | ||
| 1The weights are updated annually, and are valid for the entire year. | ||||
| Product groups | ||||
| Total index | 0.0 | 2.3 | 147.4 | 1 000.0 |
| Food | -0.8 | 5.7 | 143.5 | 177.1 |
| Beverages and tobacco | -0.7 | 5.5 | 152.3 | 14.3 |
| Crude materials, inedible, except fuels | -1.4 | -1.6 | 124.6 | 52.5 |
| Mineral fuels, lubricants and related materials | -1.2 | 3.3 | 248.0 | 231.0 |
| Chemicals and related products, n.e.s. | 3.6 | 6.6 | 148.4 | 71.2 |
| Manufactured goods classified by material | 0.6 | -0.7 | 129.4 | 131.3 |
| Machinery and transport equipment | 0.4 | 0.4 | 101.9 | 231.9 |
| Miscellaneous manufactured articles | 0.4 | 1.1 | 112.7 | 84.6 |

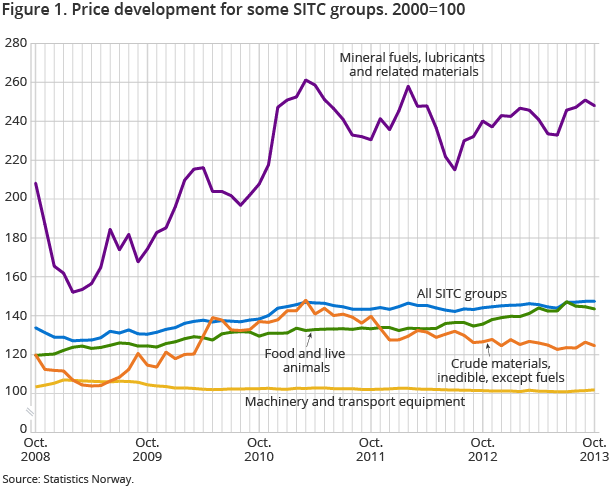
The price index of first-hand domestic sales (PIF) for all groups of goods was 147.4 in October (with 2000=100), the same as the month before. The unchanged total index is due to the cancelling out of price changes in different directions for different types of goods. Prices of inedible crude materials except fuels fell by 1.4 per cent, following a relatively steep increase in the previous month. Prices in this group have shown a falling trend since a peak in early 2011, albeit with fluctuations from month to month. The most important goods in the group are ores used for production of nickel and aluminium.
Prices of mineral fuels, lubricants and electricity fell by 1.2 per cent from September to October. Lower prices for petroleum products and natural gas led to a decline in the overall index, although the price of electricity increased by 2.4 per cent.
Food prices have fallen in the past three months, and from September to October the rate of decline was 0.8 per cent. The fall was mainly due to lower prices for fish, vegetables and fruits. Despite this recent development, food prices are still higher than one year ago. Compared with October 2012, they have grown by 5.7 per cent.
Higher prices for more refined goods
While prices for crude materials, food and fuels fell from September to October, prices of more refined products increased. Prices of chemical products have grown over three years, with some monthly variations, and from September to October prices showed a relatively strong increase of 3.6 per cent. In the groups manufactured goods classified by material and machinery and transportation equipment, prices have had a declining trend over the past years. However, from September to October, prices also increased here. The growth was 0.6 per cent for manufactured goods and 0.4 per cent for machinery and transportation equipment.
Higher import prices
PIF describes the development in prices both of goods produced in Norway and imported goods. The overall index for domestically produced goods fell by 0.3 per cent from September to October. This means that the index for imported goods increased, as the total index was unchanged. One factor behind the increase could be the depreciation of the Norwegian Krone (NOK). The central bank’s import weighted currency index shows that the NOK depreciated 1.3 per cent against other currencies from September to October. All things being equal, this makes Norwegian imports more expensive, measured in NOK.
Twelve-month rate: prices up 2.3 per cent
PIF increased by 2.3 per cent from October 2012 to October 2013. An important reason for the overall growth was the price of electricity, which was 17.4 per cent higher than in the same month last year. This is a much lower rate of growth than the previous months, however. In September, electricity prices were 40 per cent higher than one year before. The fall in the twelve-month growth rate is due to a steep increase of 22 per cent from September to October last year, which was not matched by the relatively modest increase of 2.4 per cent in the same period this year.
Additional information
Contact
-
Producer price index
E-mail: produsentpris@ssb.no
tel.: (+47) 21 09 40 00
-
Elisabeth Mælum
E-mail: elisabeth.maelum@ssb.no
tel.: (+47) 97 01 28 49
-
Monika Græsli Engebretsen
E-mail: monika.graesli.engebretsen@ssb.no
tel.: (+47) 40 90 23 71
-
Morten Madshus
E-mail: morten.madshus@ssb.no
tel.: (+47) 40 90 26 94
